Overview
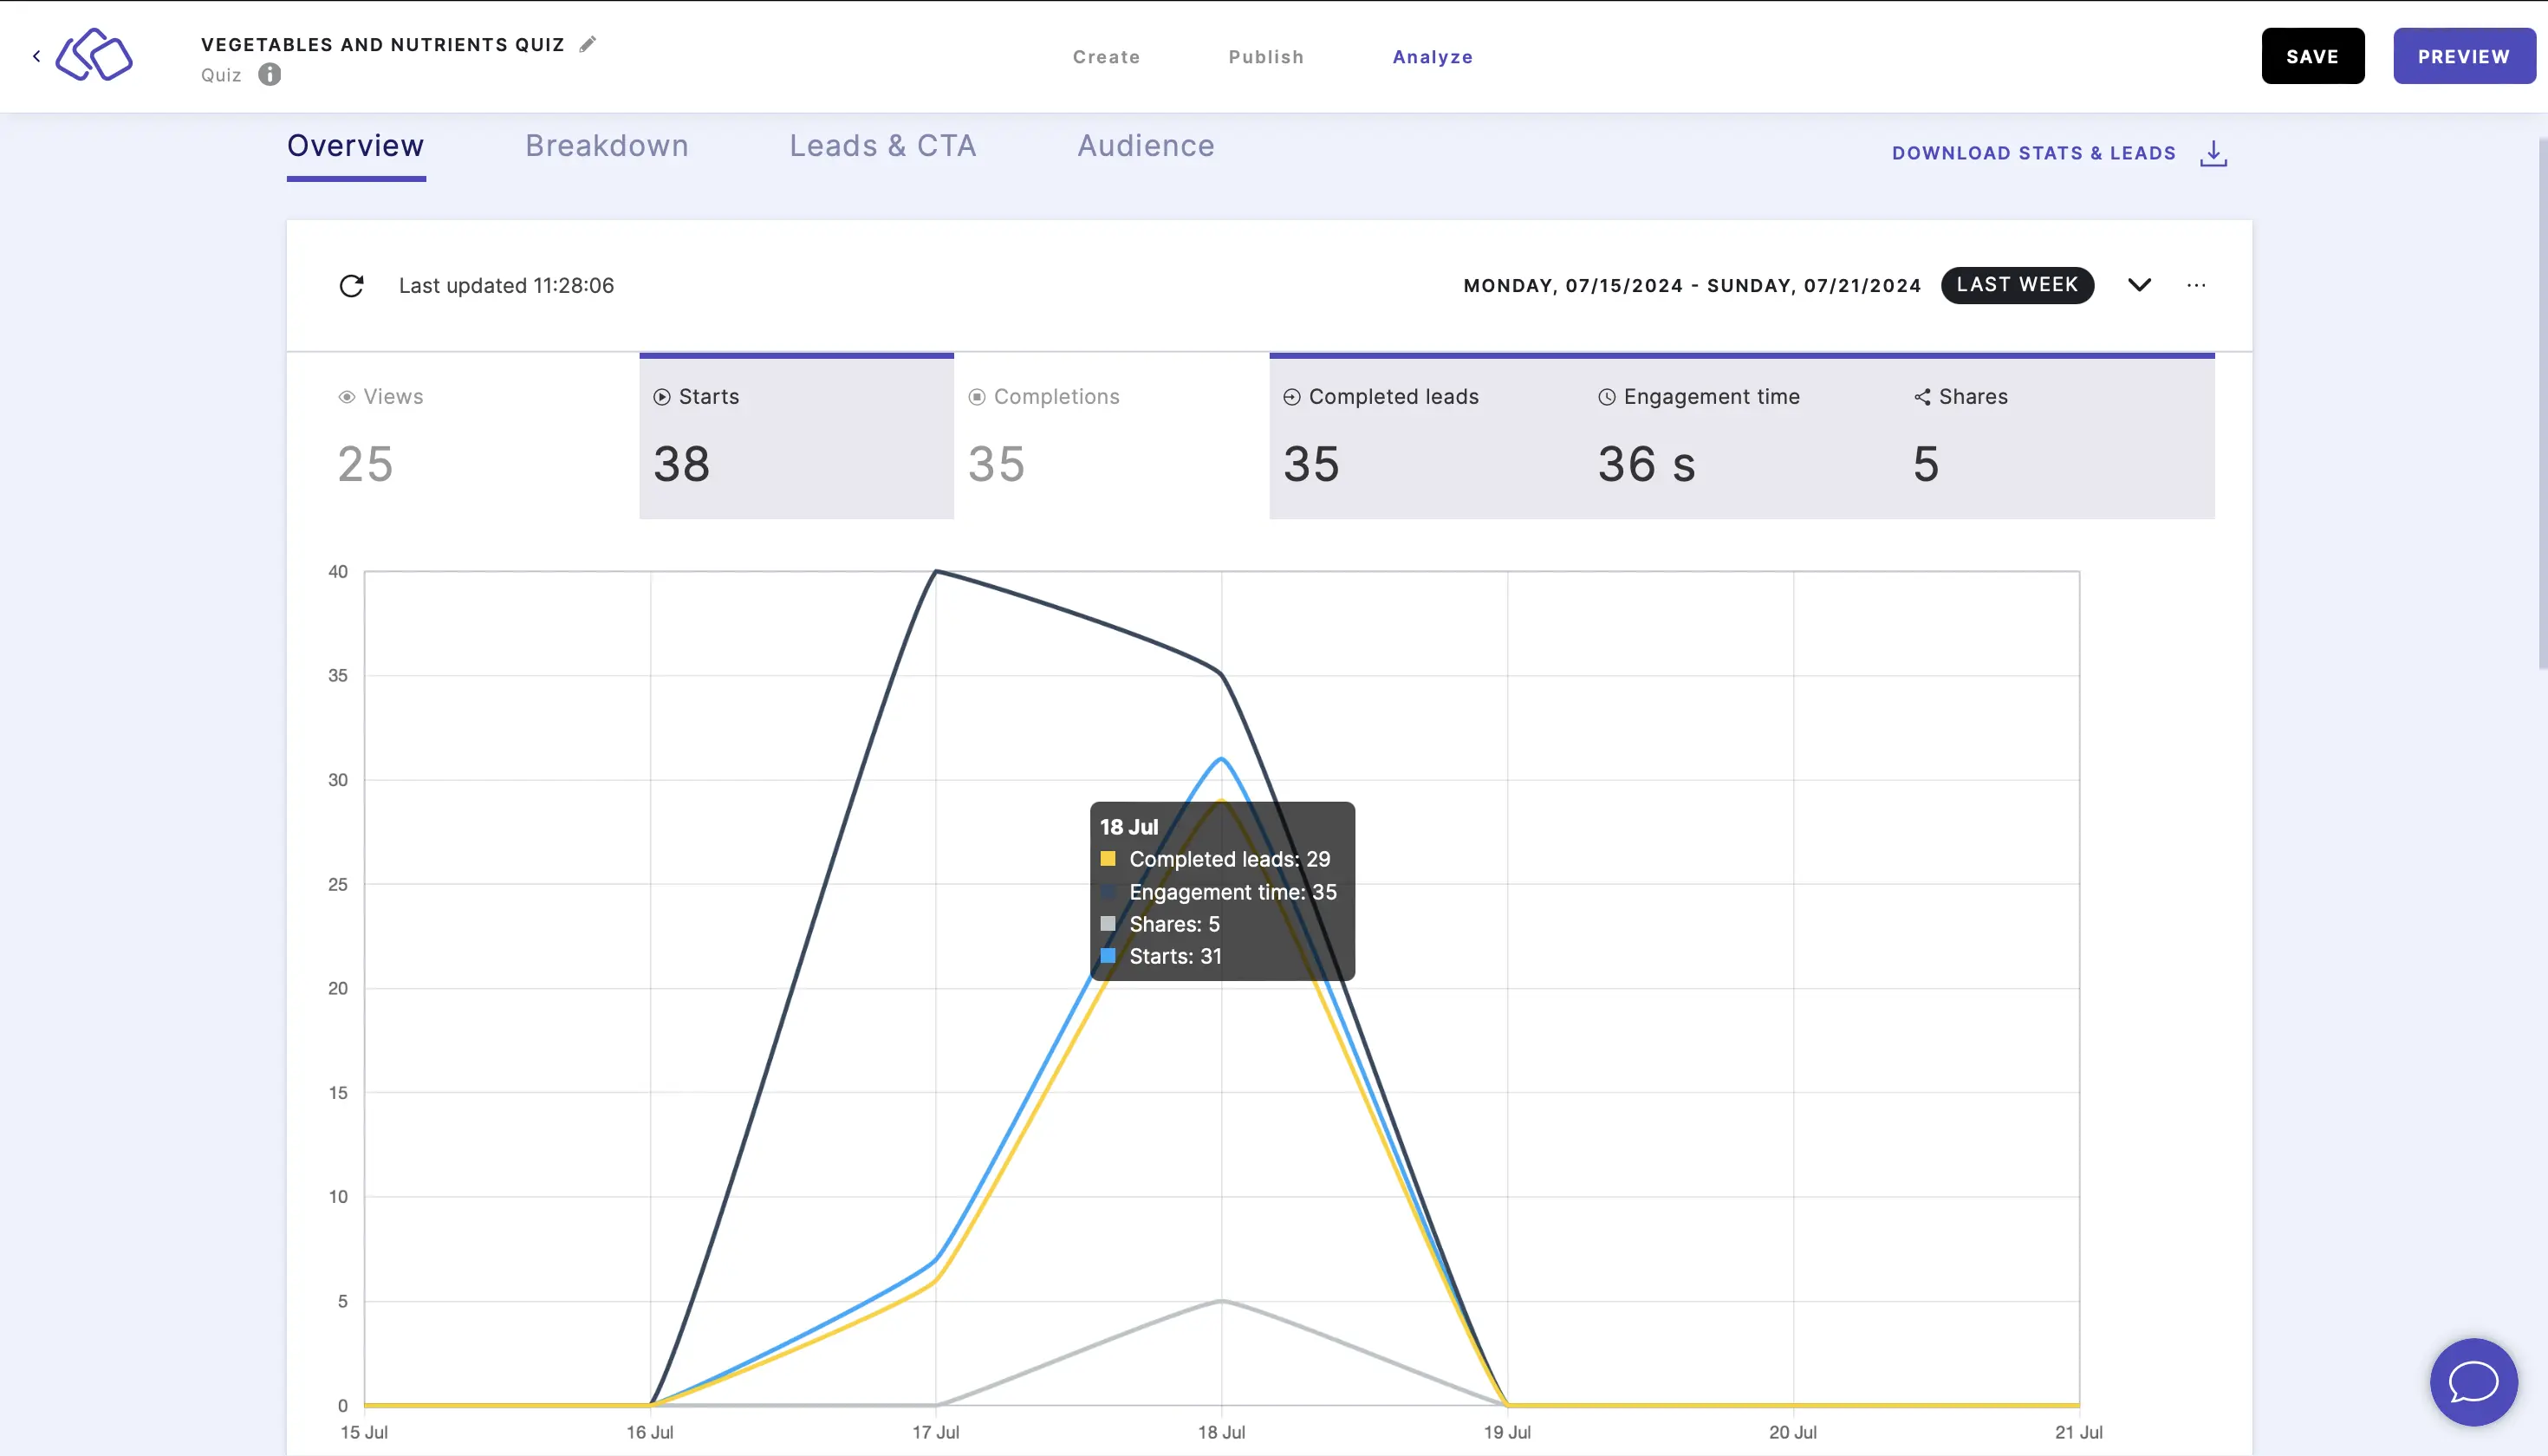
See your Riddle's key performance metrics at a glance: views, starts, completions, completed leads, average engagement time, and shares. Use the view-to-start ratio to gauge whether your Riddle's intro is compelling, and the start-to-completion ratio to spot drop-offs.
- Select or deselect any heading to see the data you need on the line graph.
Views, Starts, and Completions are on the graph by default.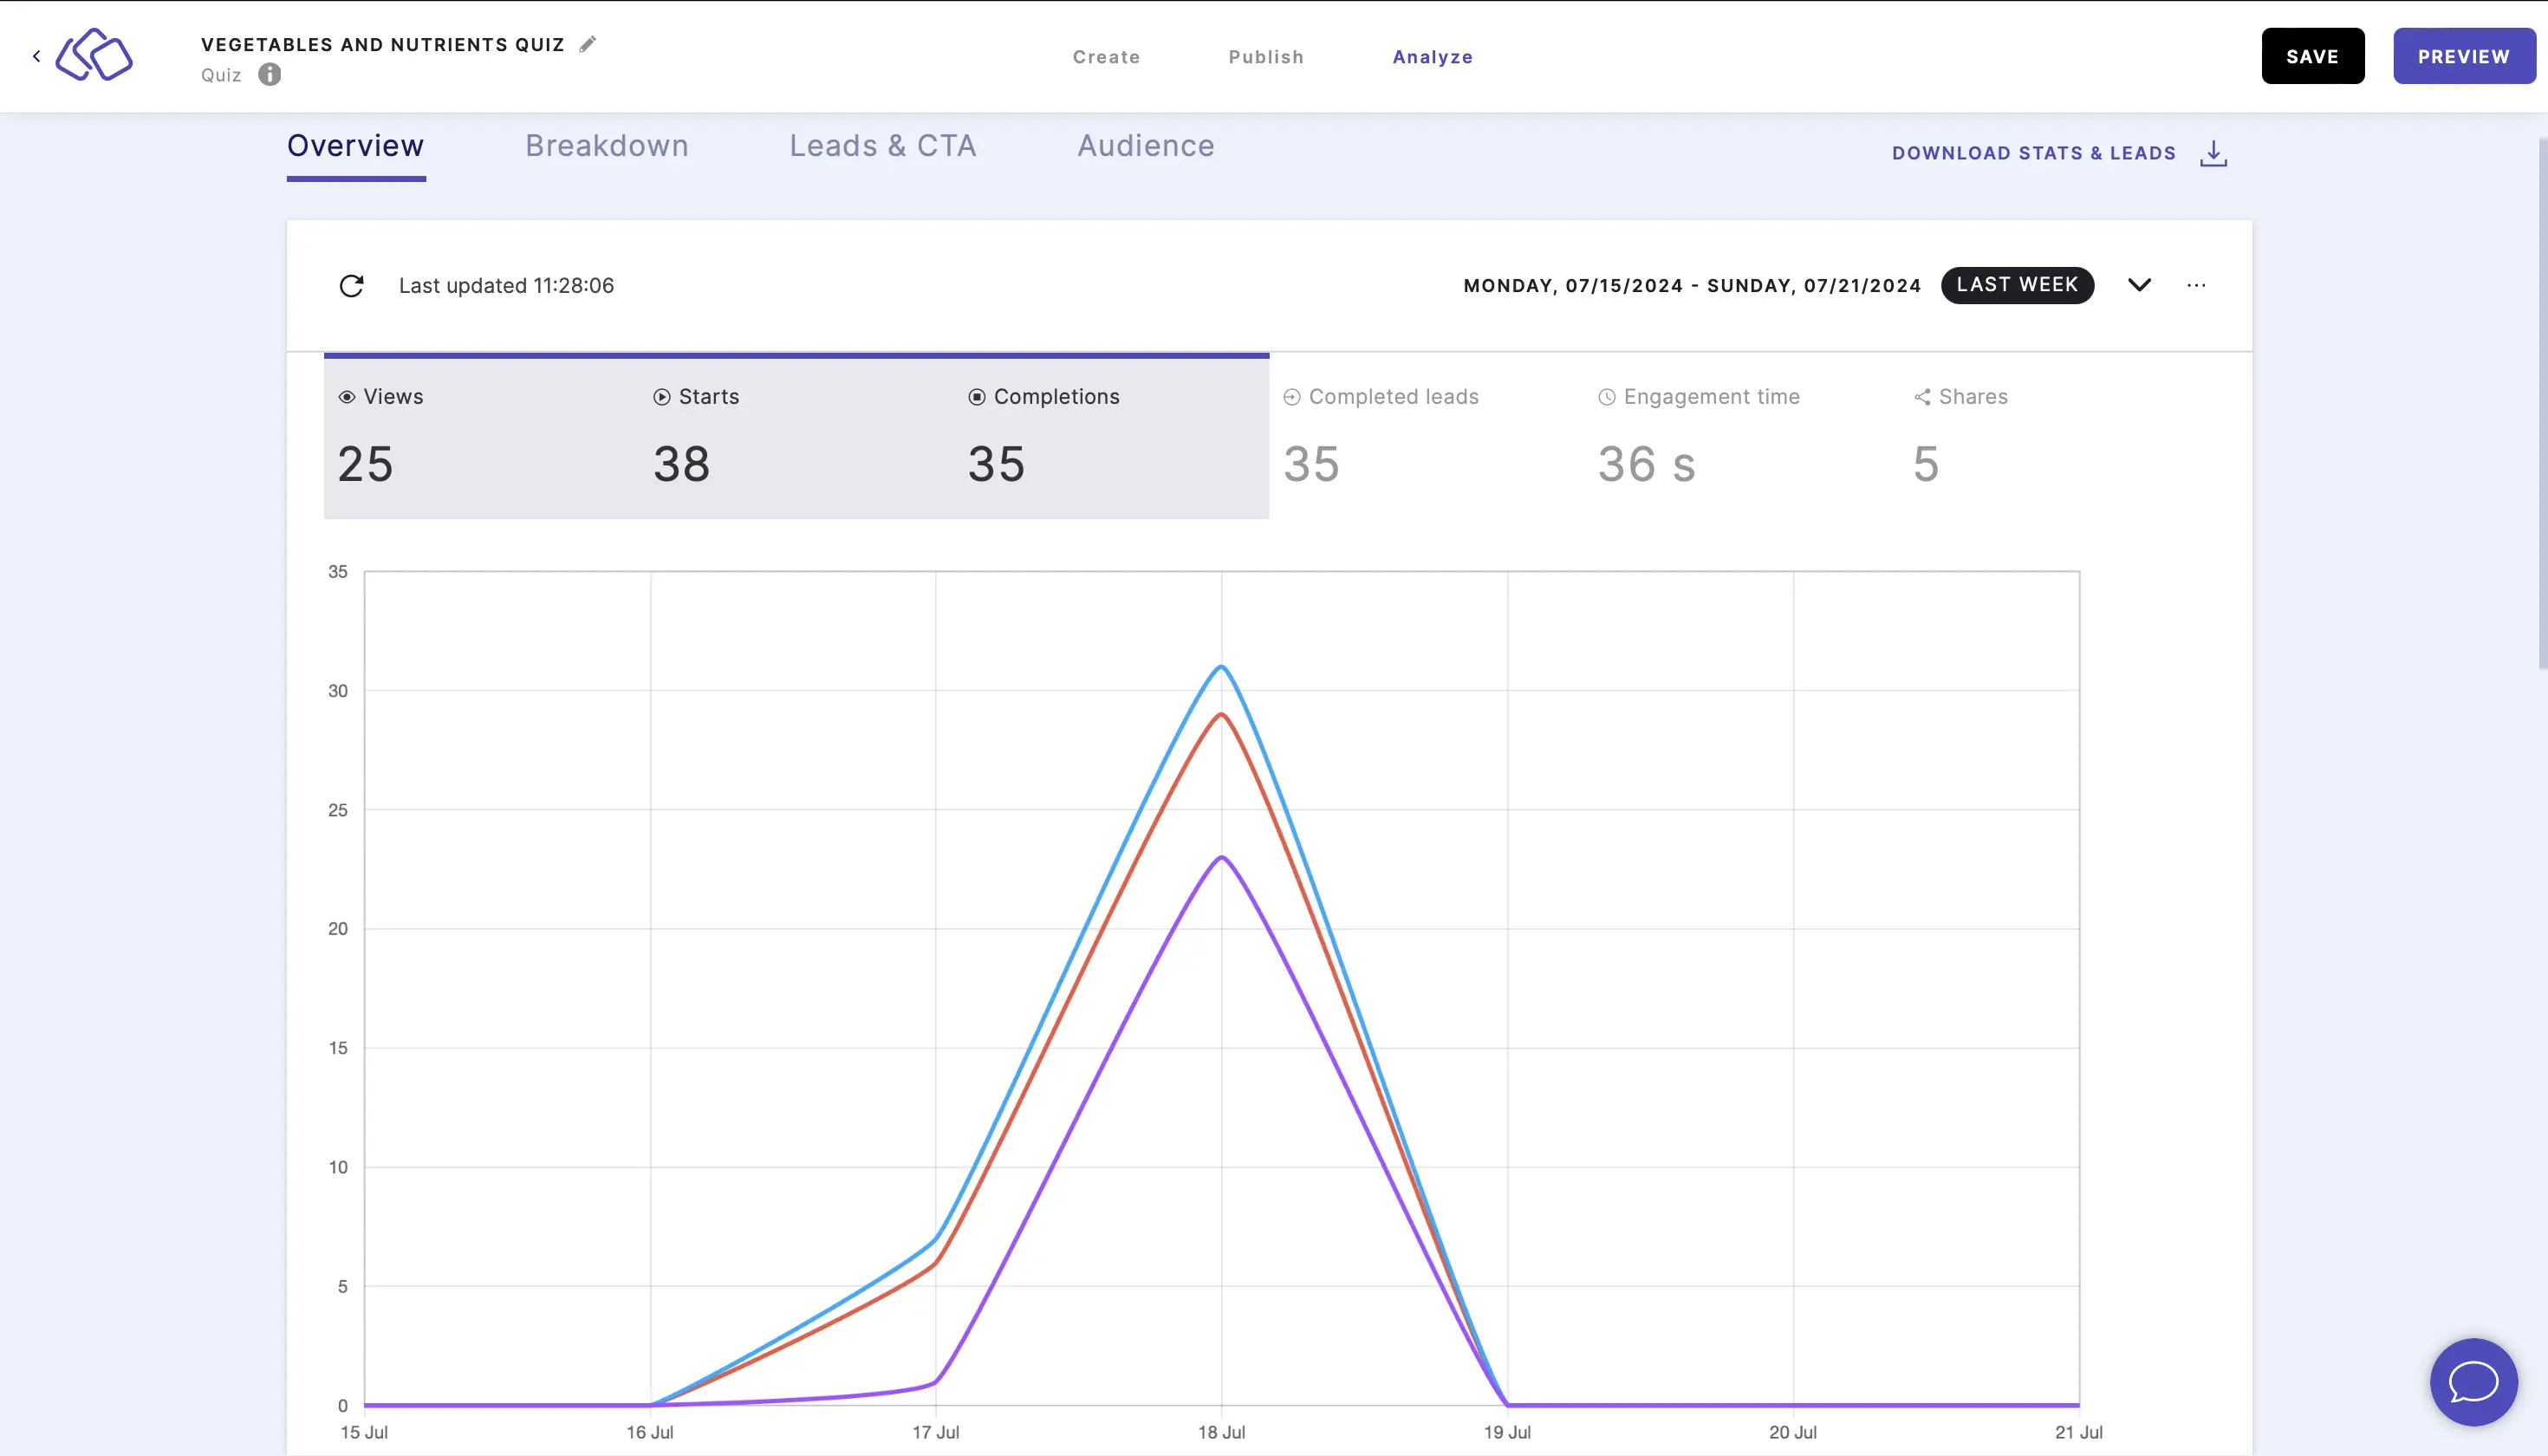
- Hover over any line to see the data summarized for any given date.
- The default view and time range is set to current week. To view live stats, click on the down arrow on the right and click on LIVE STATS. As soon as the Riddle is viewed or played, all associated statistics will appear on this dashboard here as they come in without refreshing the page.
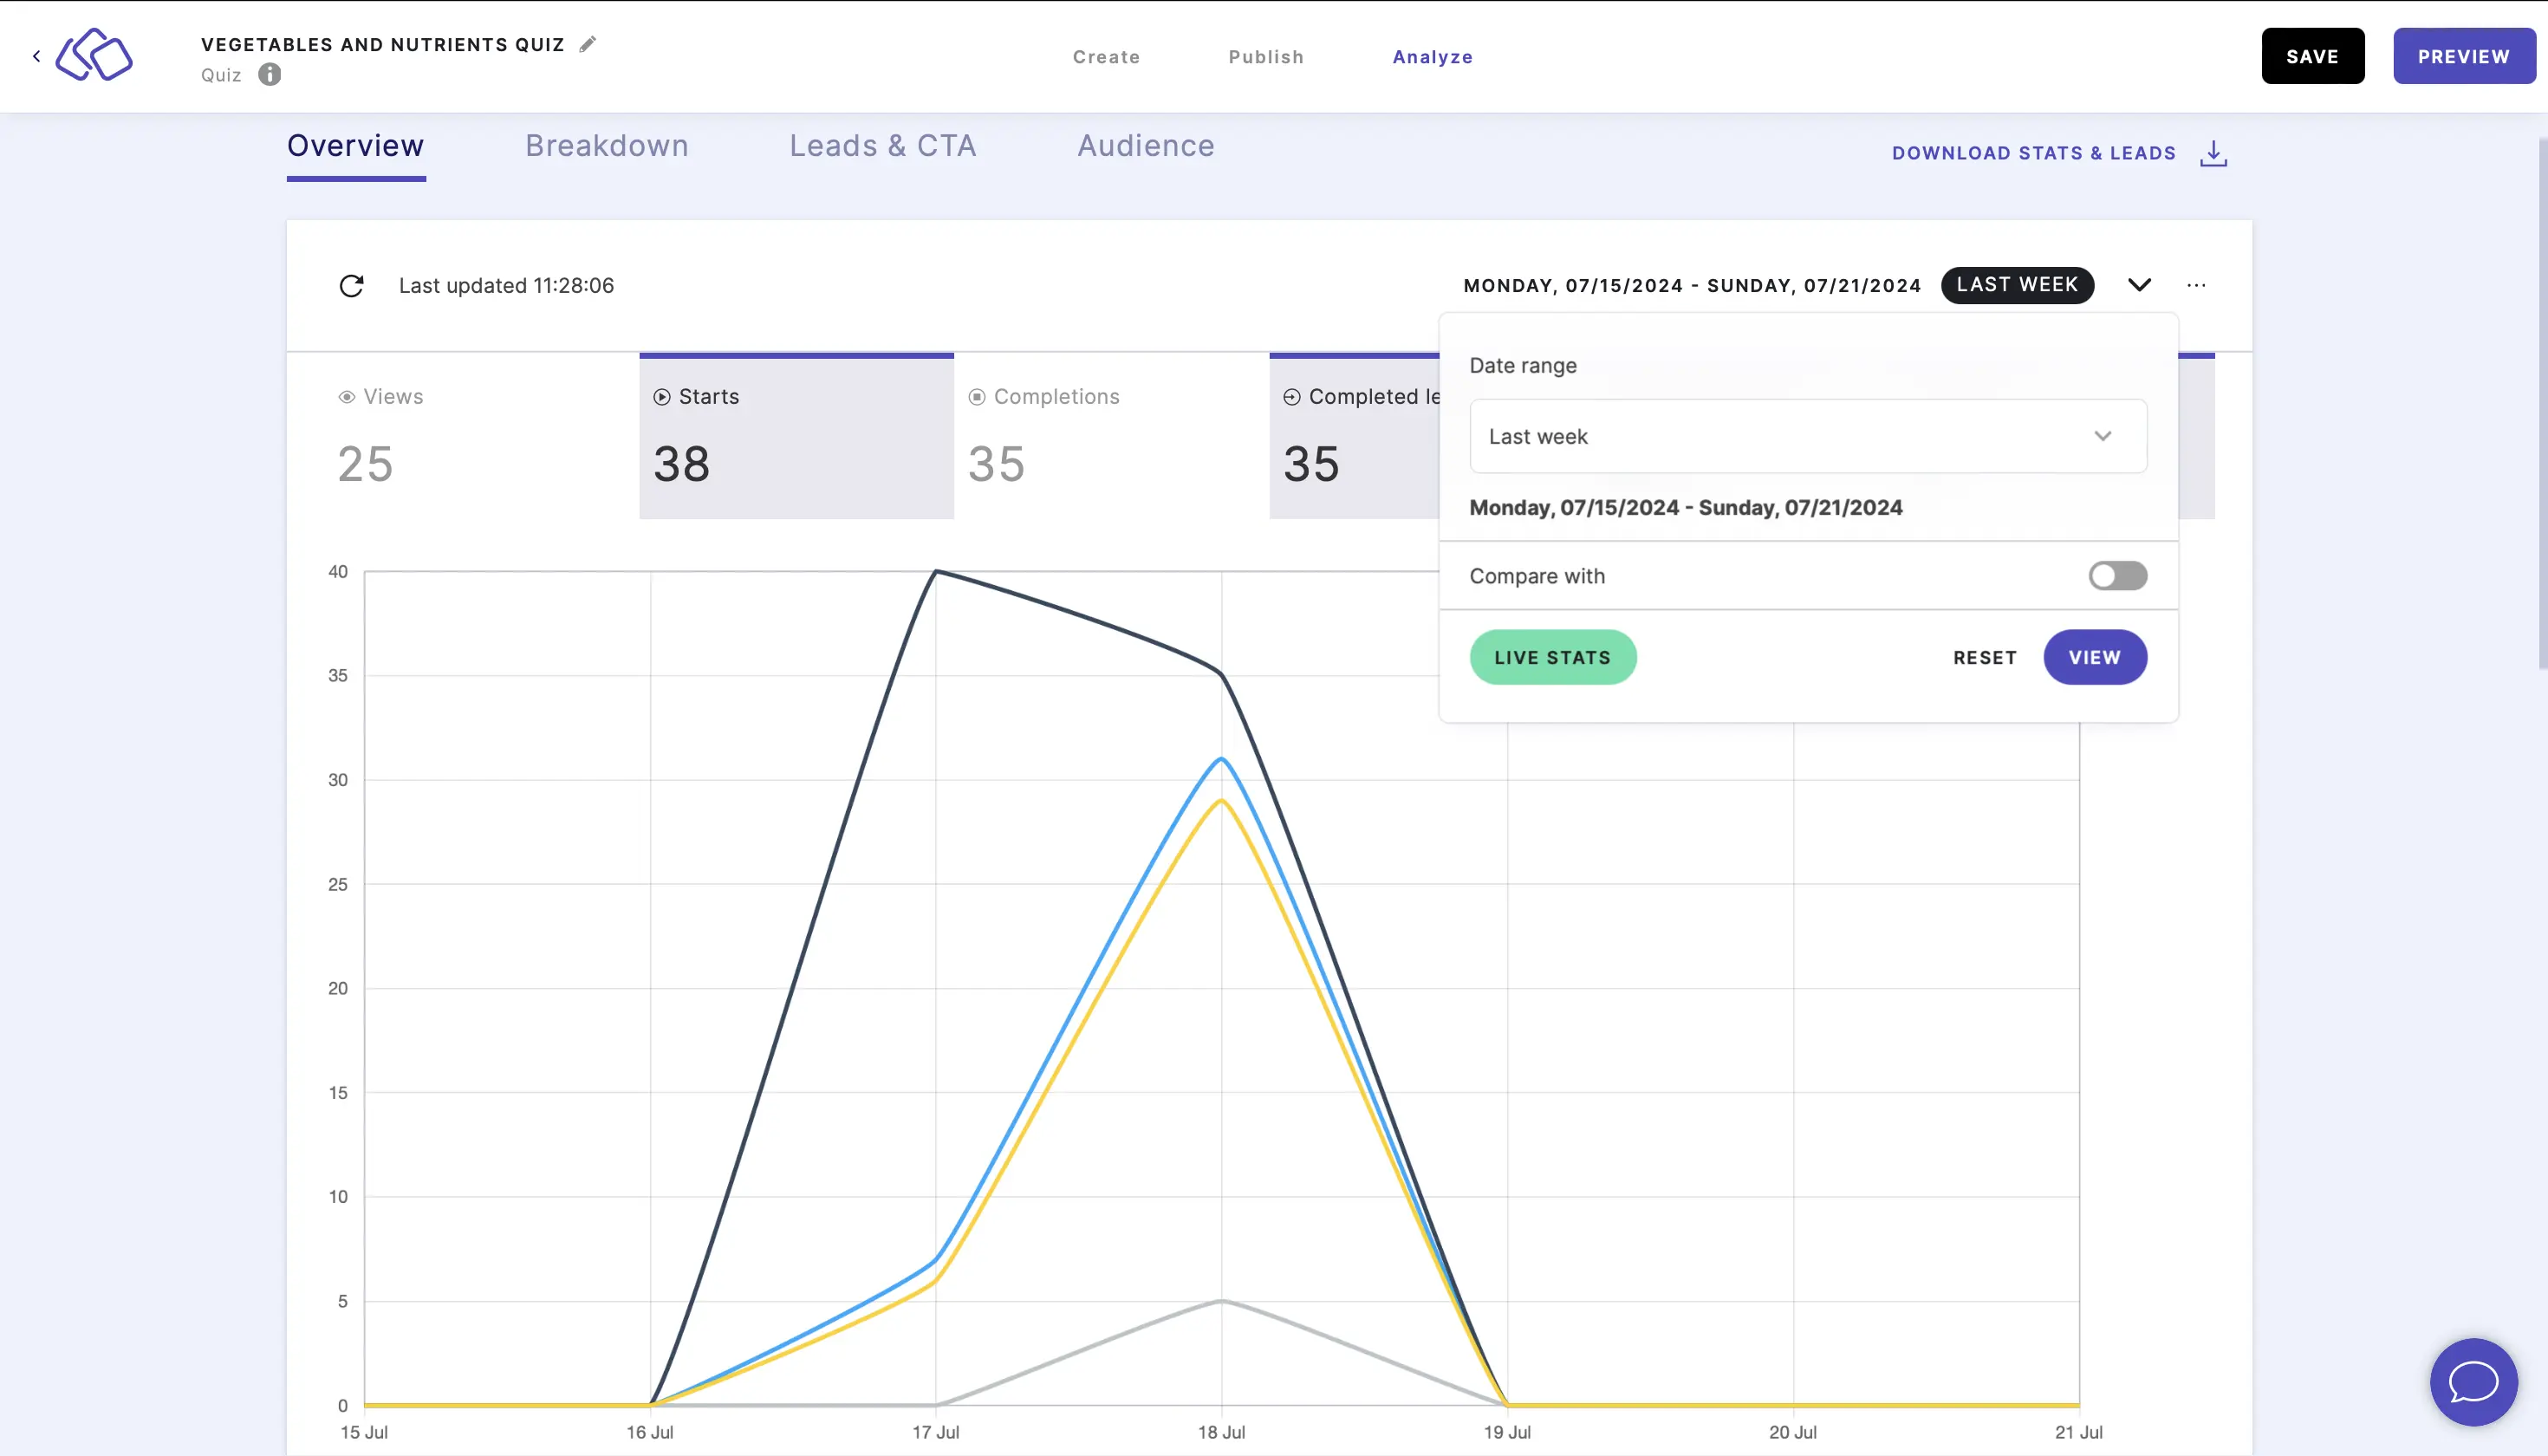
- To filter the stats to a specific time range, click on the down arrow on the right, select a date range, and click on VIEW.
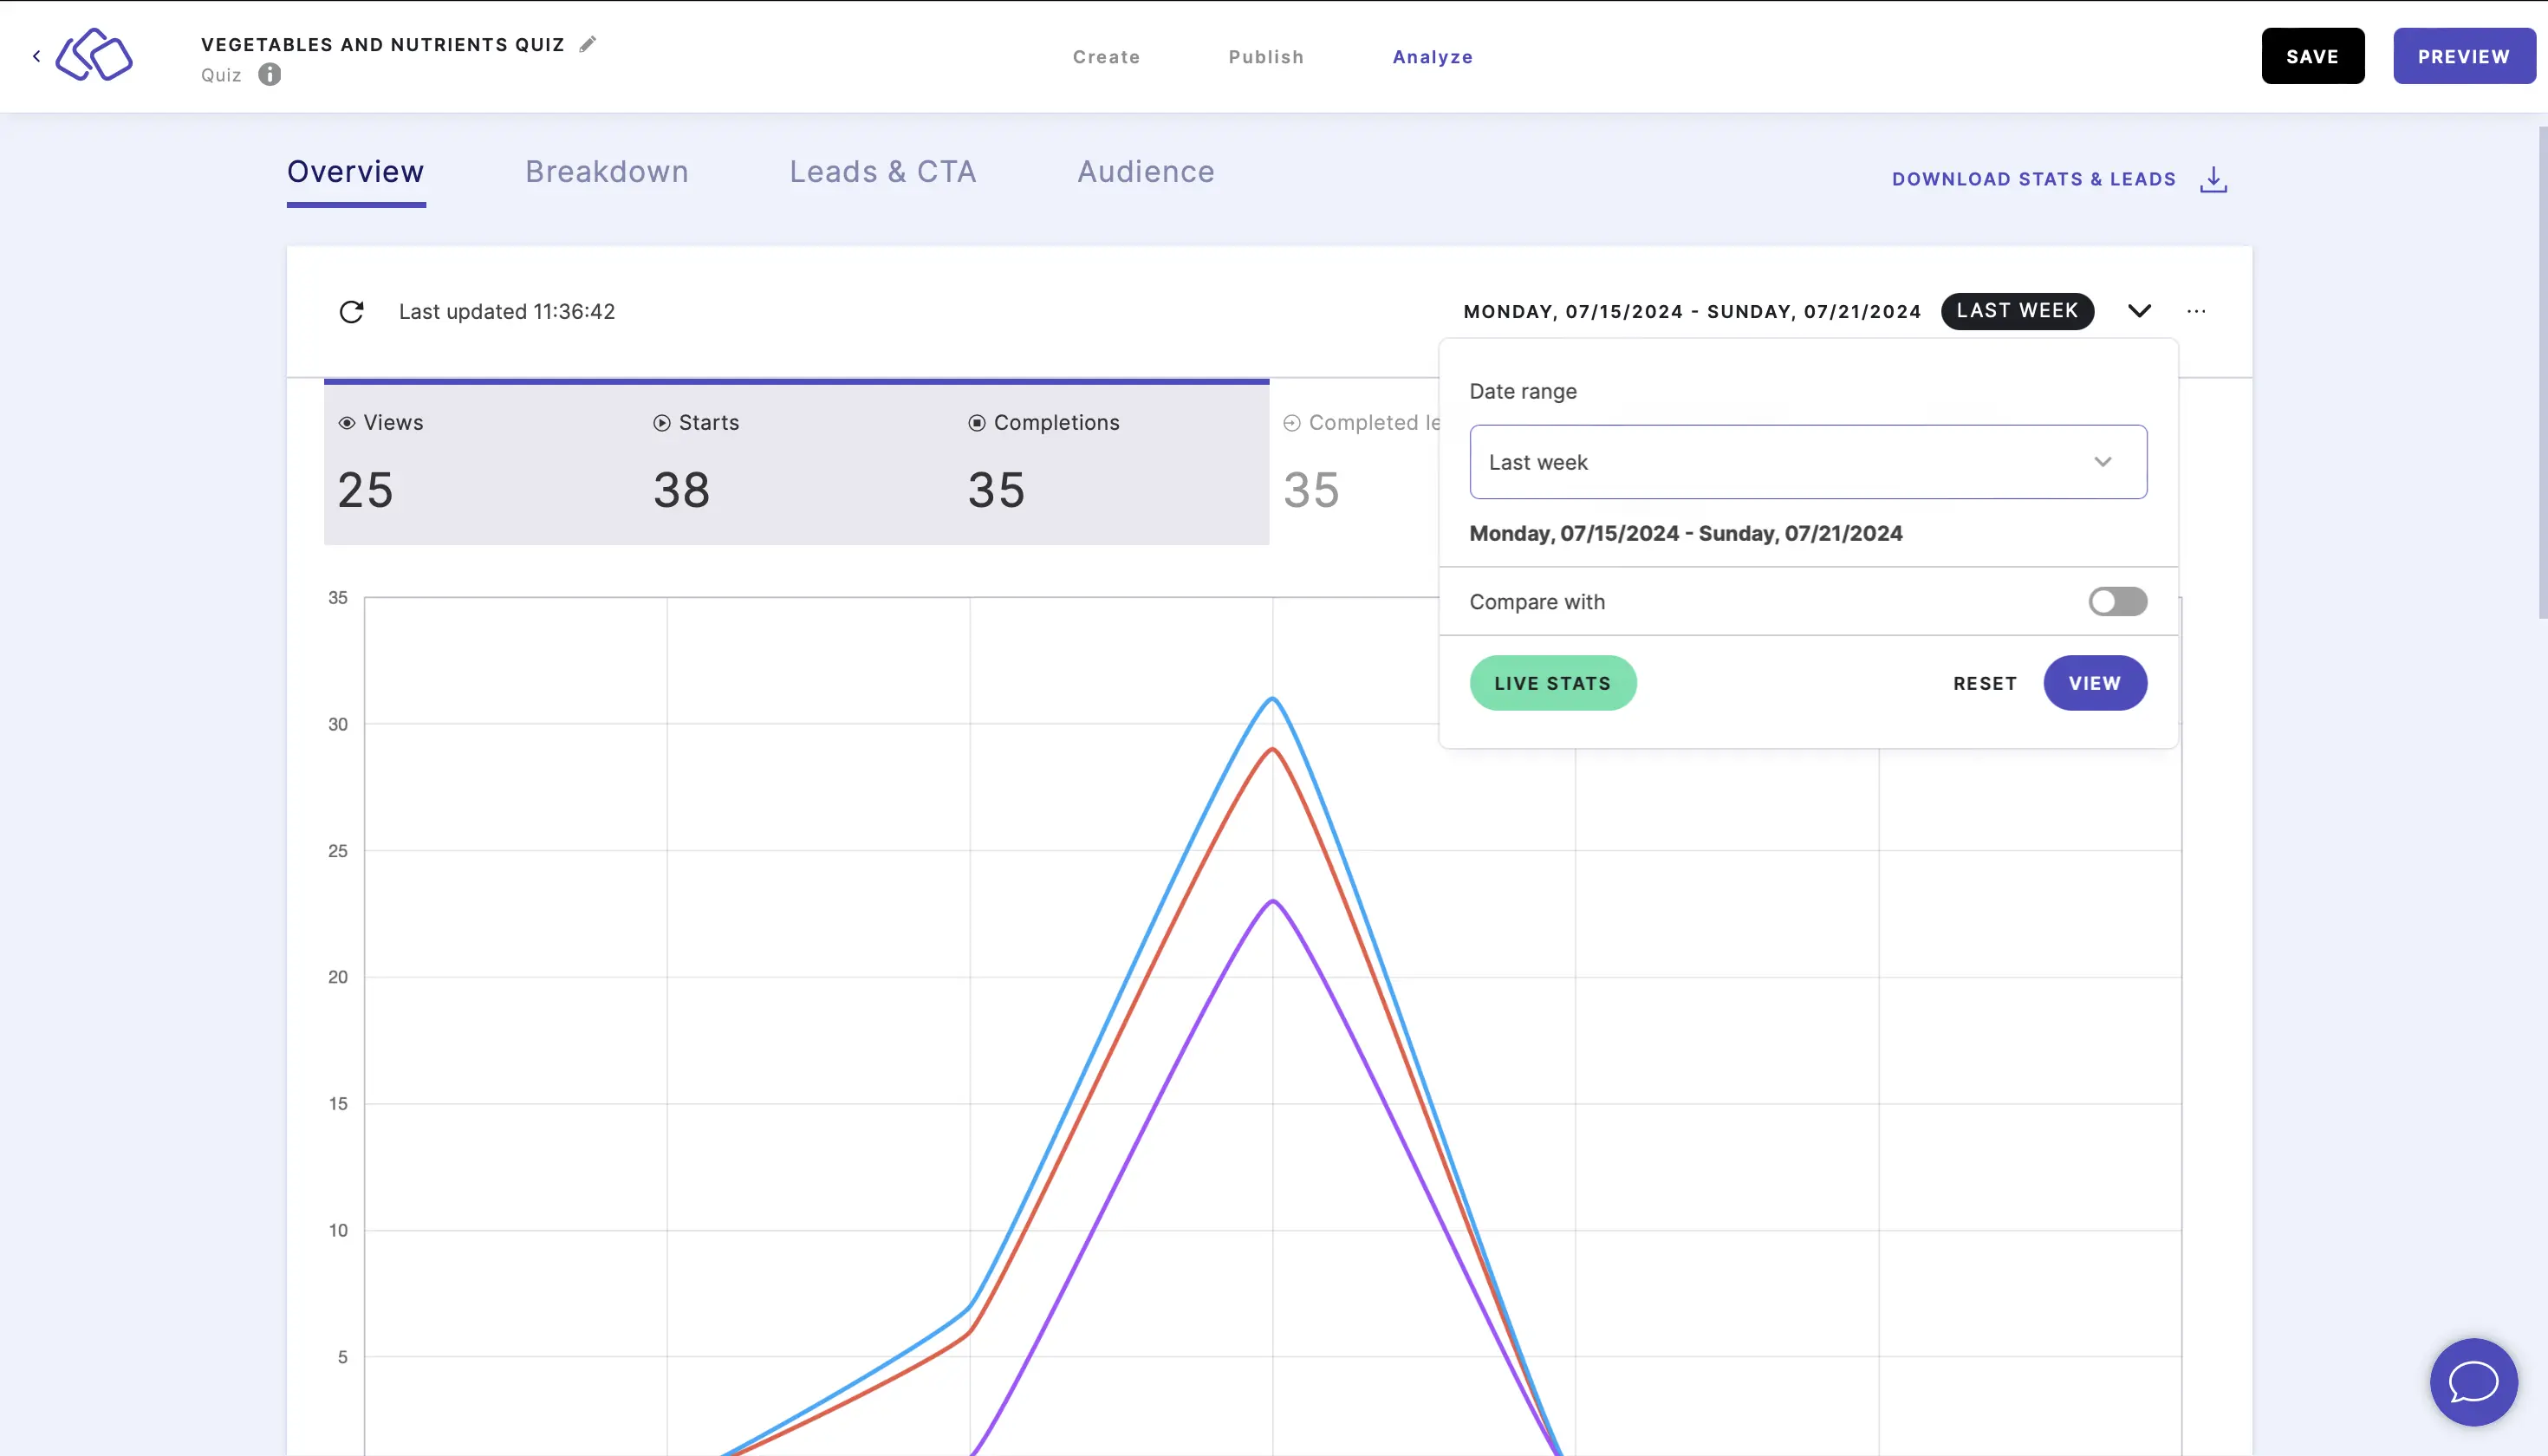
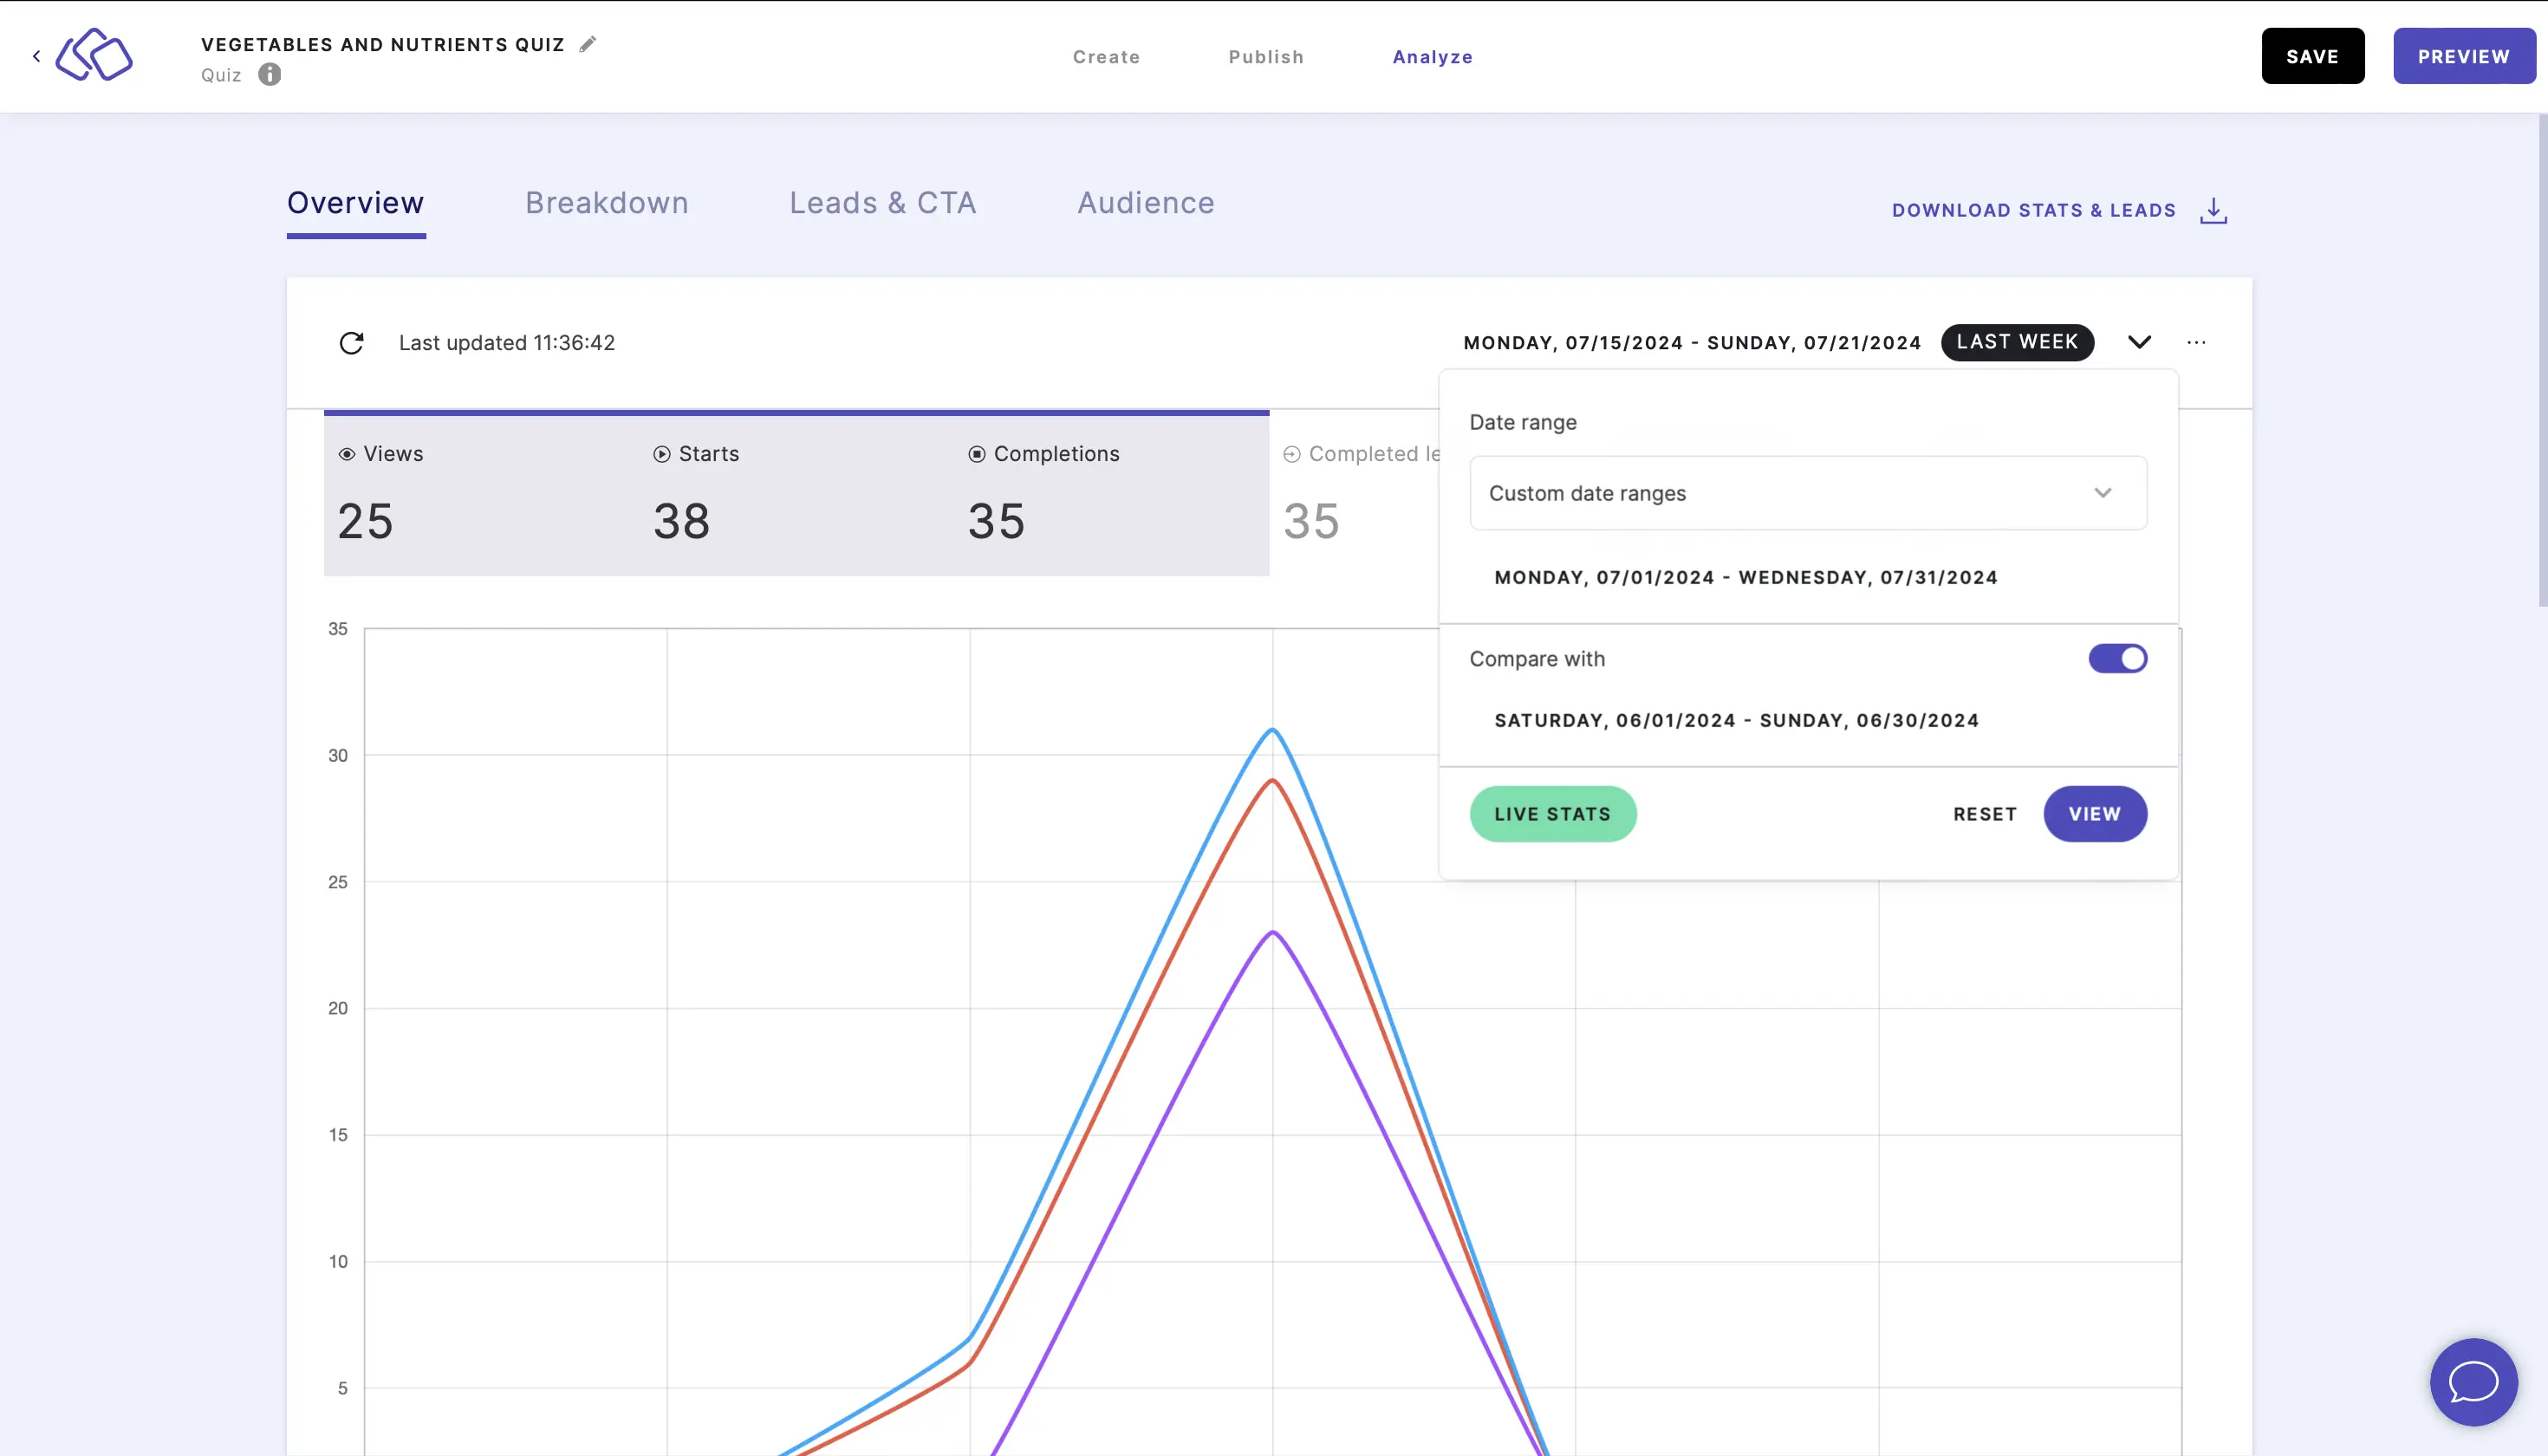
- To compare two custom time ranges, click on the down arrow on the right, select and input Custom date ranges, enable Compare with, and click on VIEW.
- To delete stats, click on the three dots on the right, click on RESET STATS, and in the pop-up that appears select the checkbox and click on OK.
Caution: This will delete all statistics for this Riddle.
Understand the overview
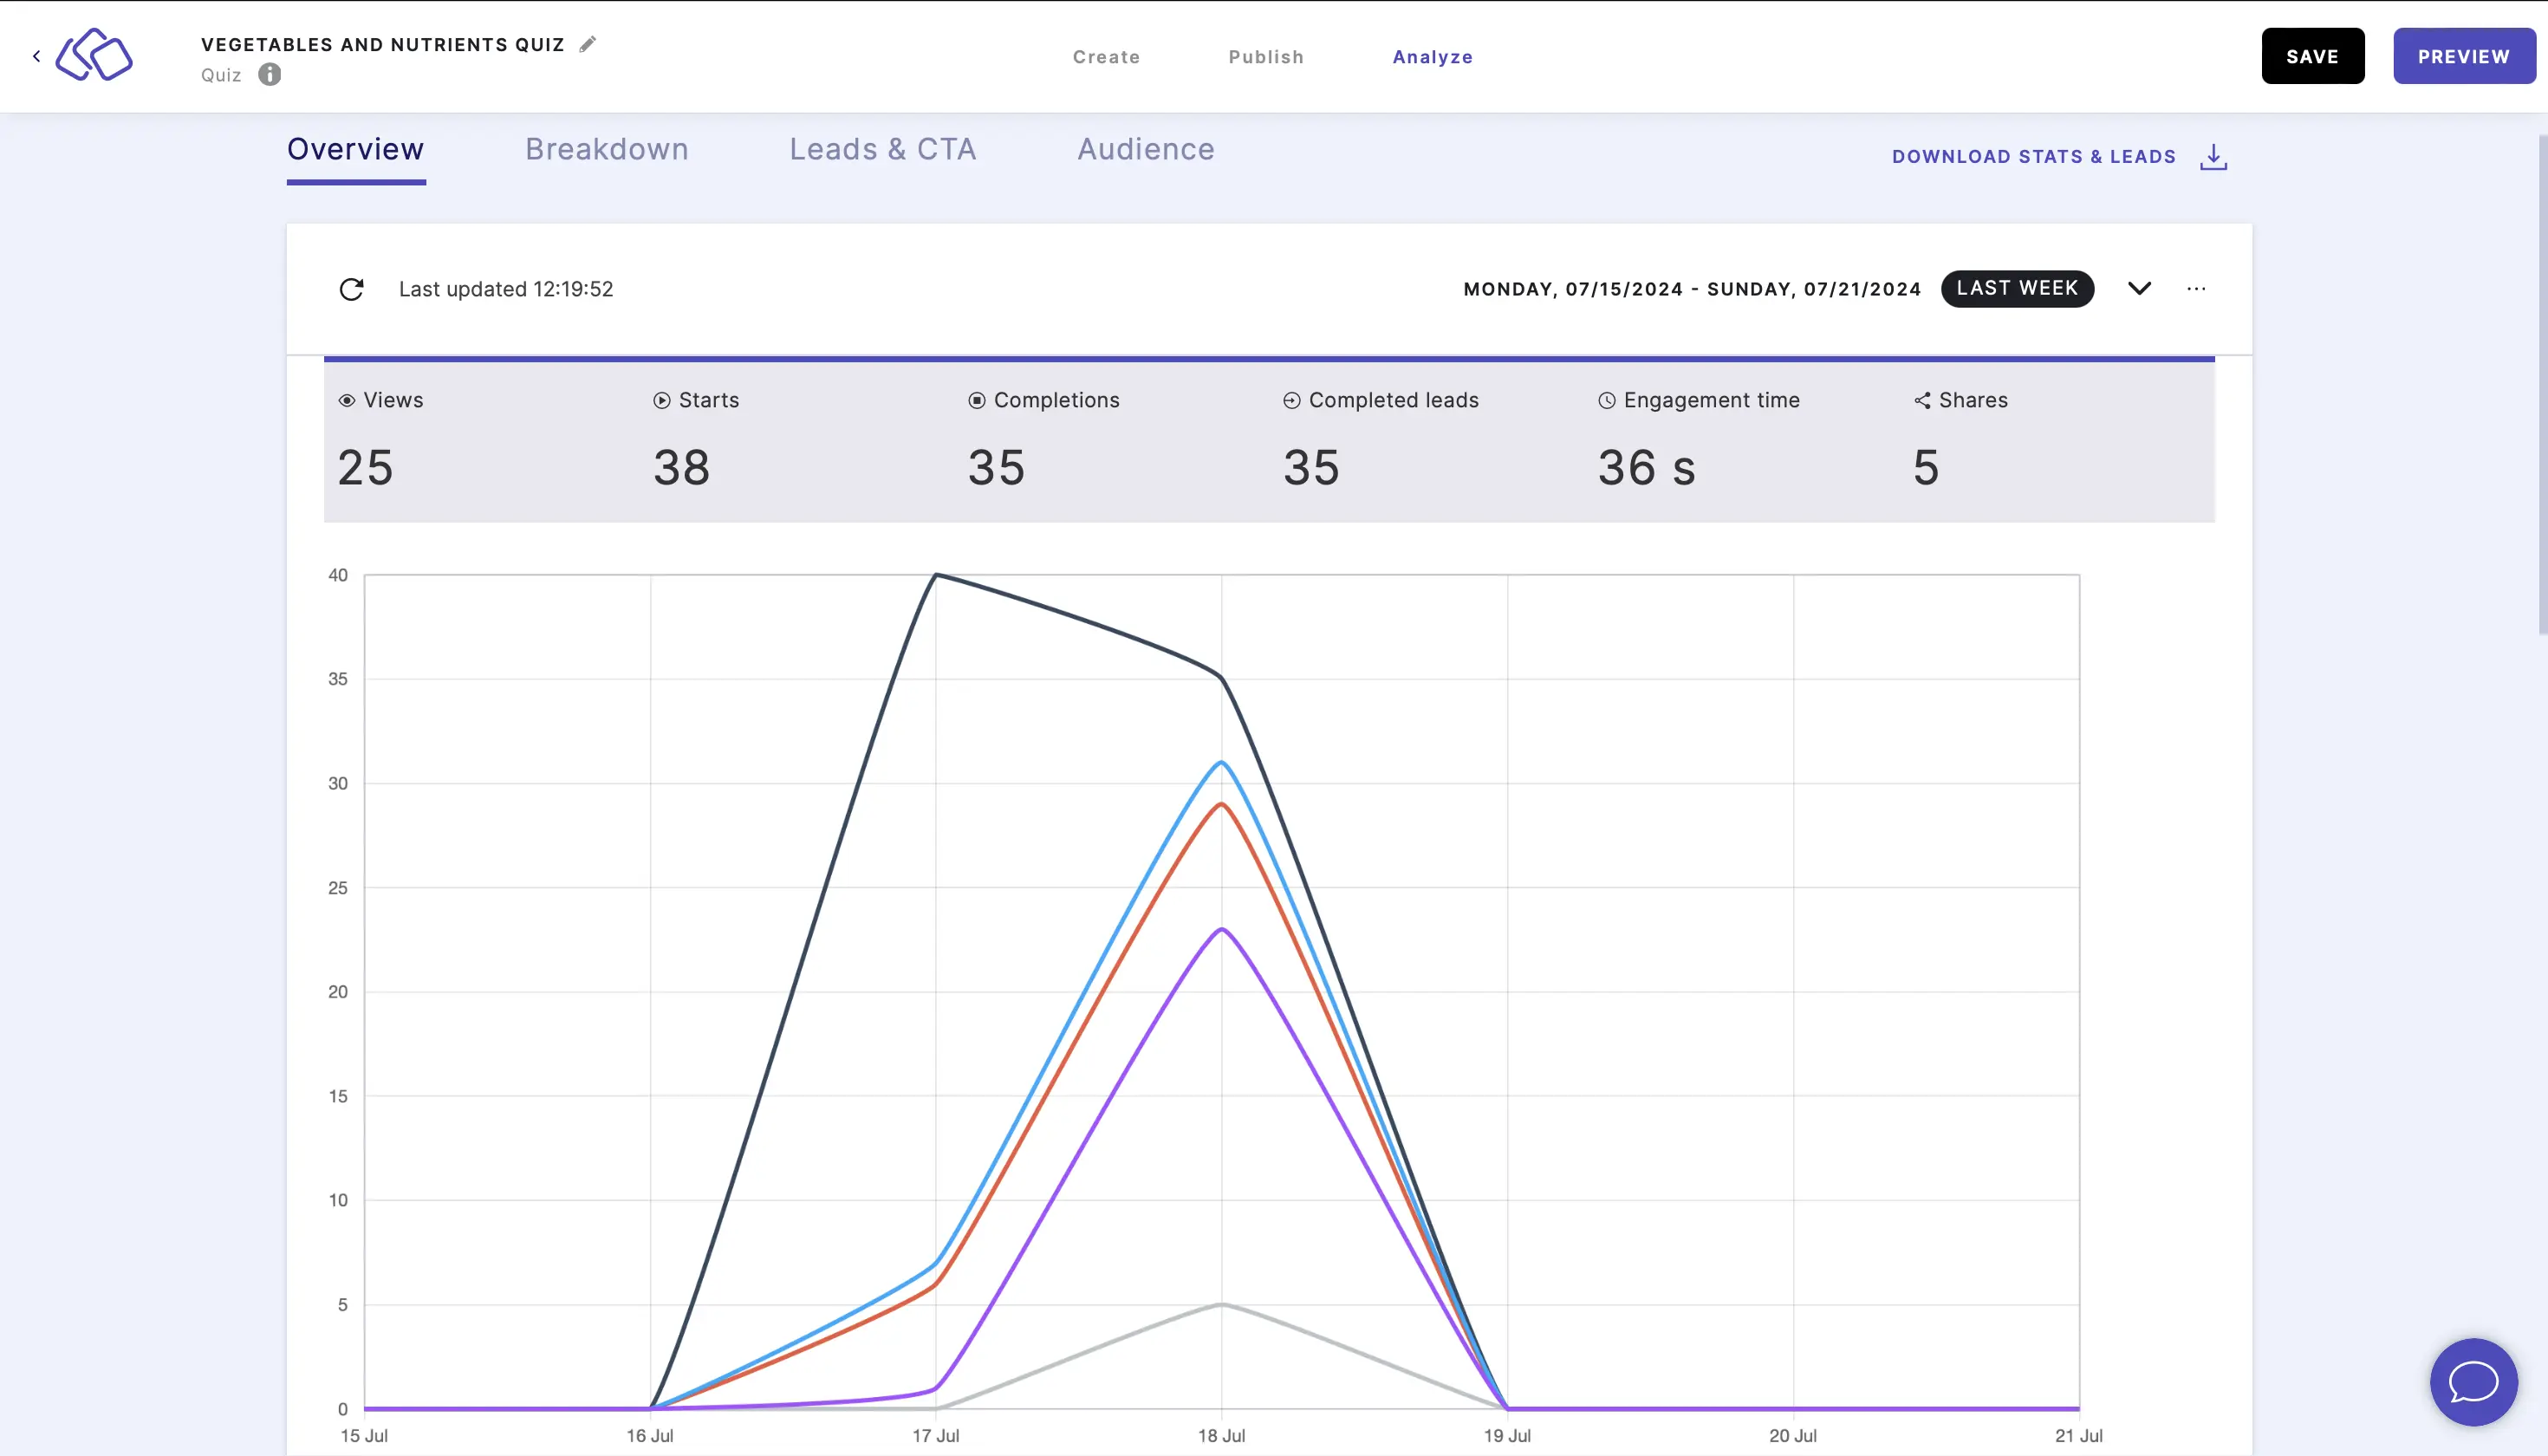
- Views are the number of times your Riddle was seen (loaded on a page plus viewed on the landing page version of the Riddle).
- Starts are the number of times your Riddle was opened and started, but not necessarily completed.
- Completions are the number of times your Riddle was done until the end.
- Leads completed are the number of leads where every required form field was filled out and the lead identifier was filled out.
- Engagement time is the average number of seconds and / or minutes spent on that Riddle on that day, regardless of whether they finish it or not.
If someone stops a Riddle but leaves the Riddle page open, an automatic timeout will happen at 30 minutes. These 30 minutes will then be subtracted from the time spent on the Riddle to keep your data clean. - Shares are the number of times someone shared their Riddle results using the share button you integrated into your Riddle.
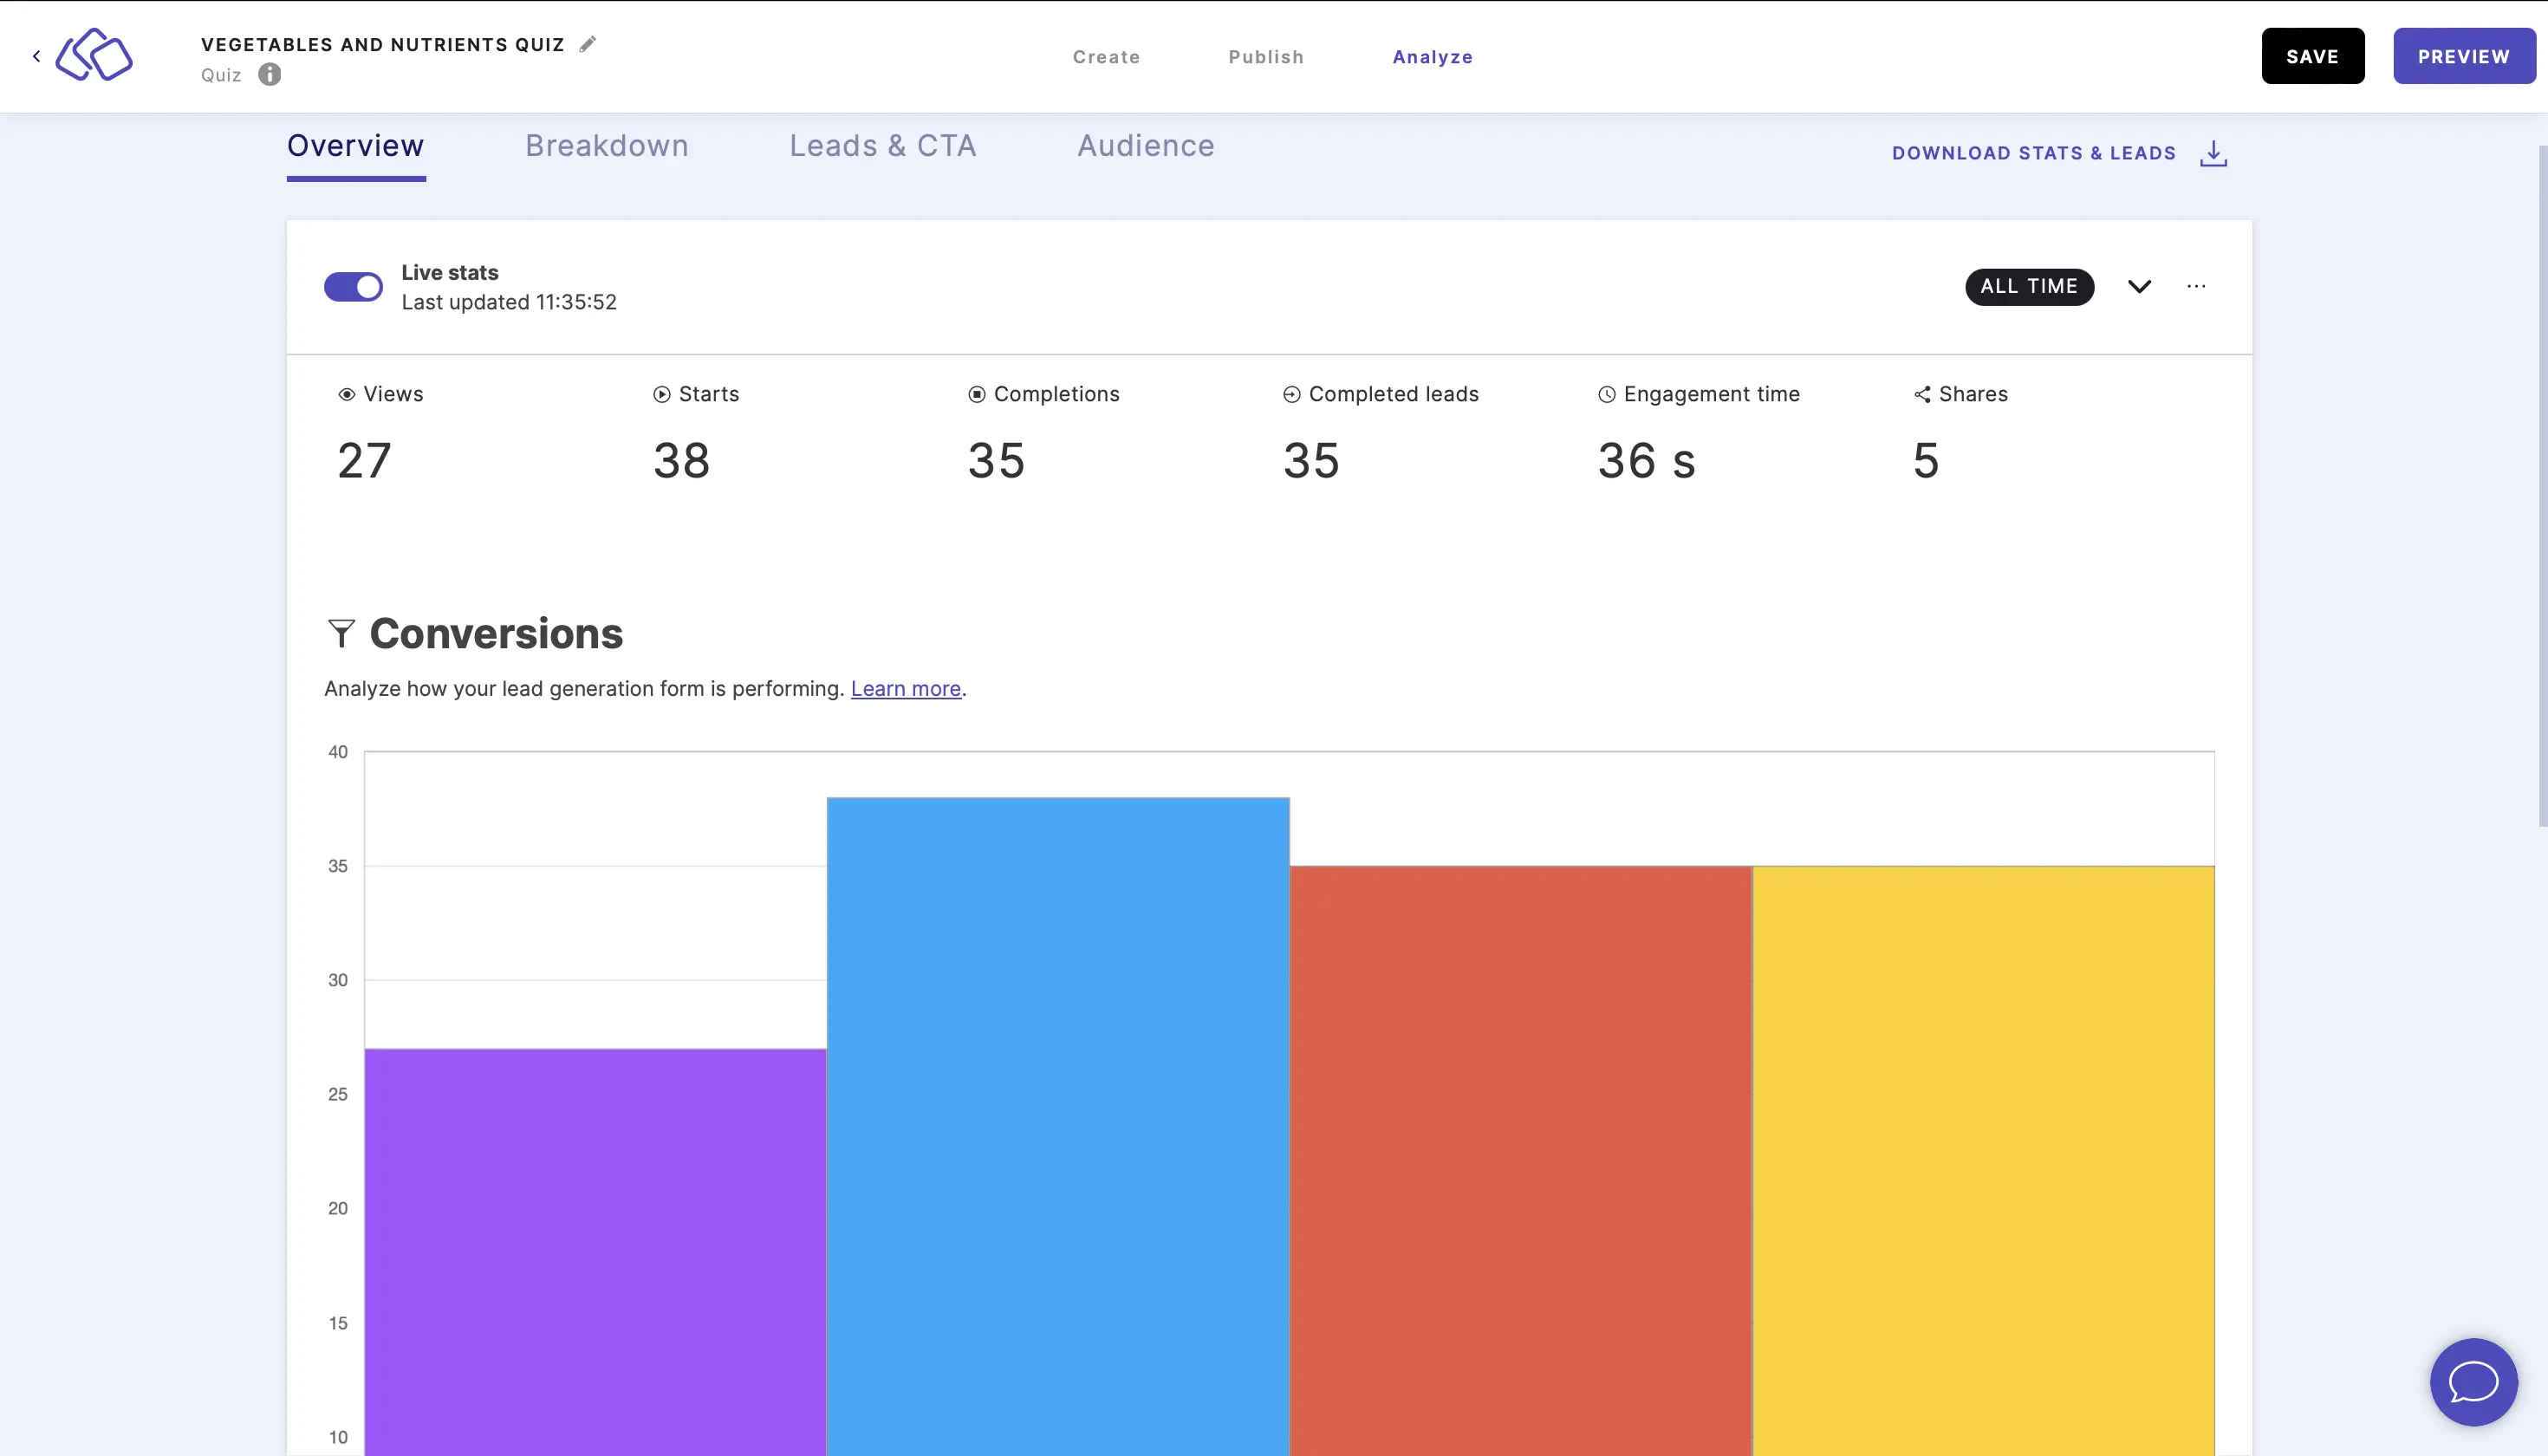
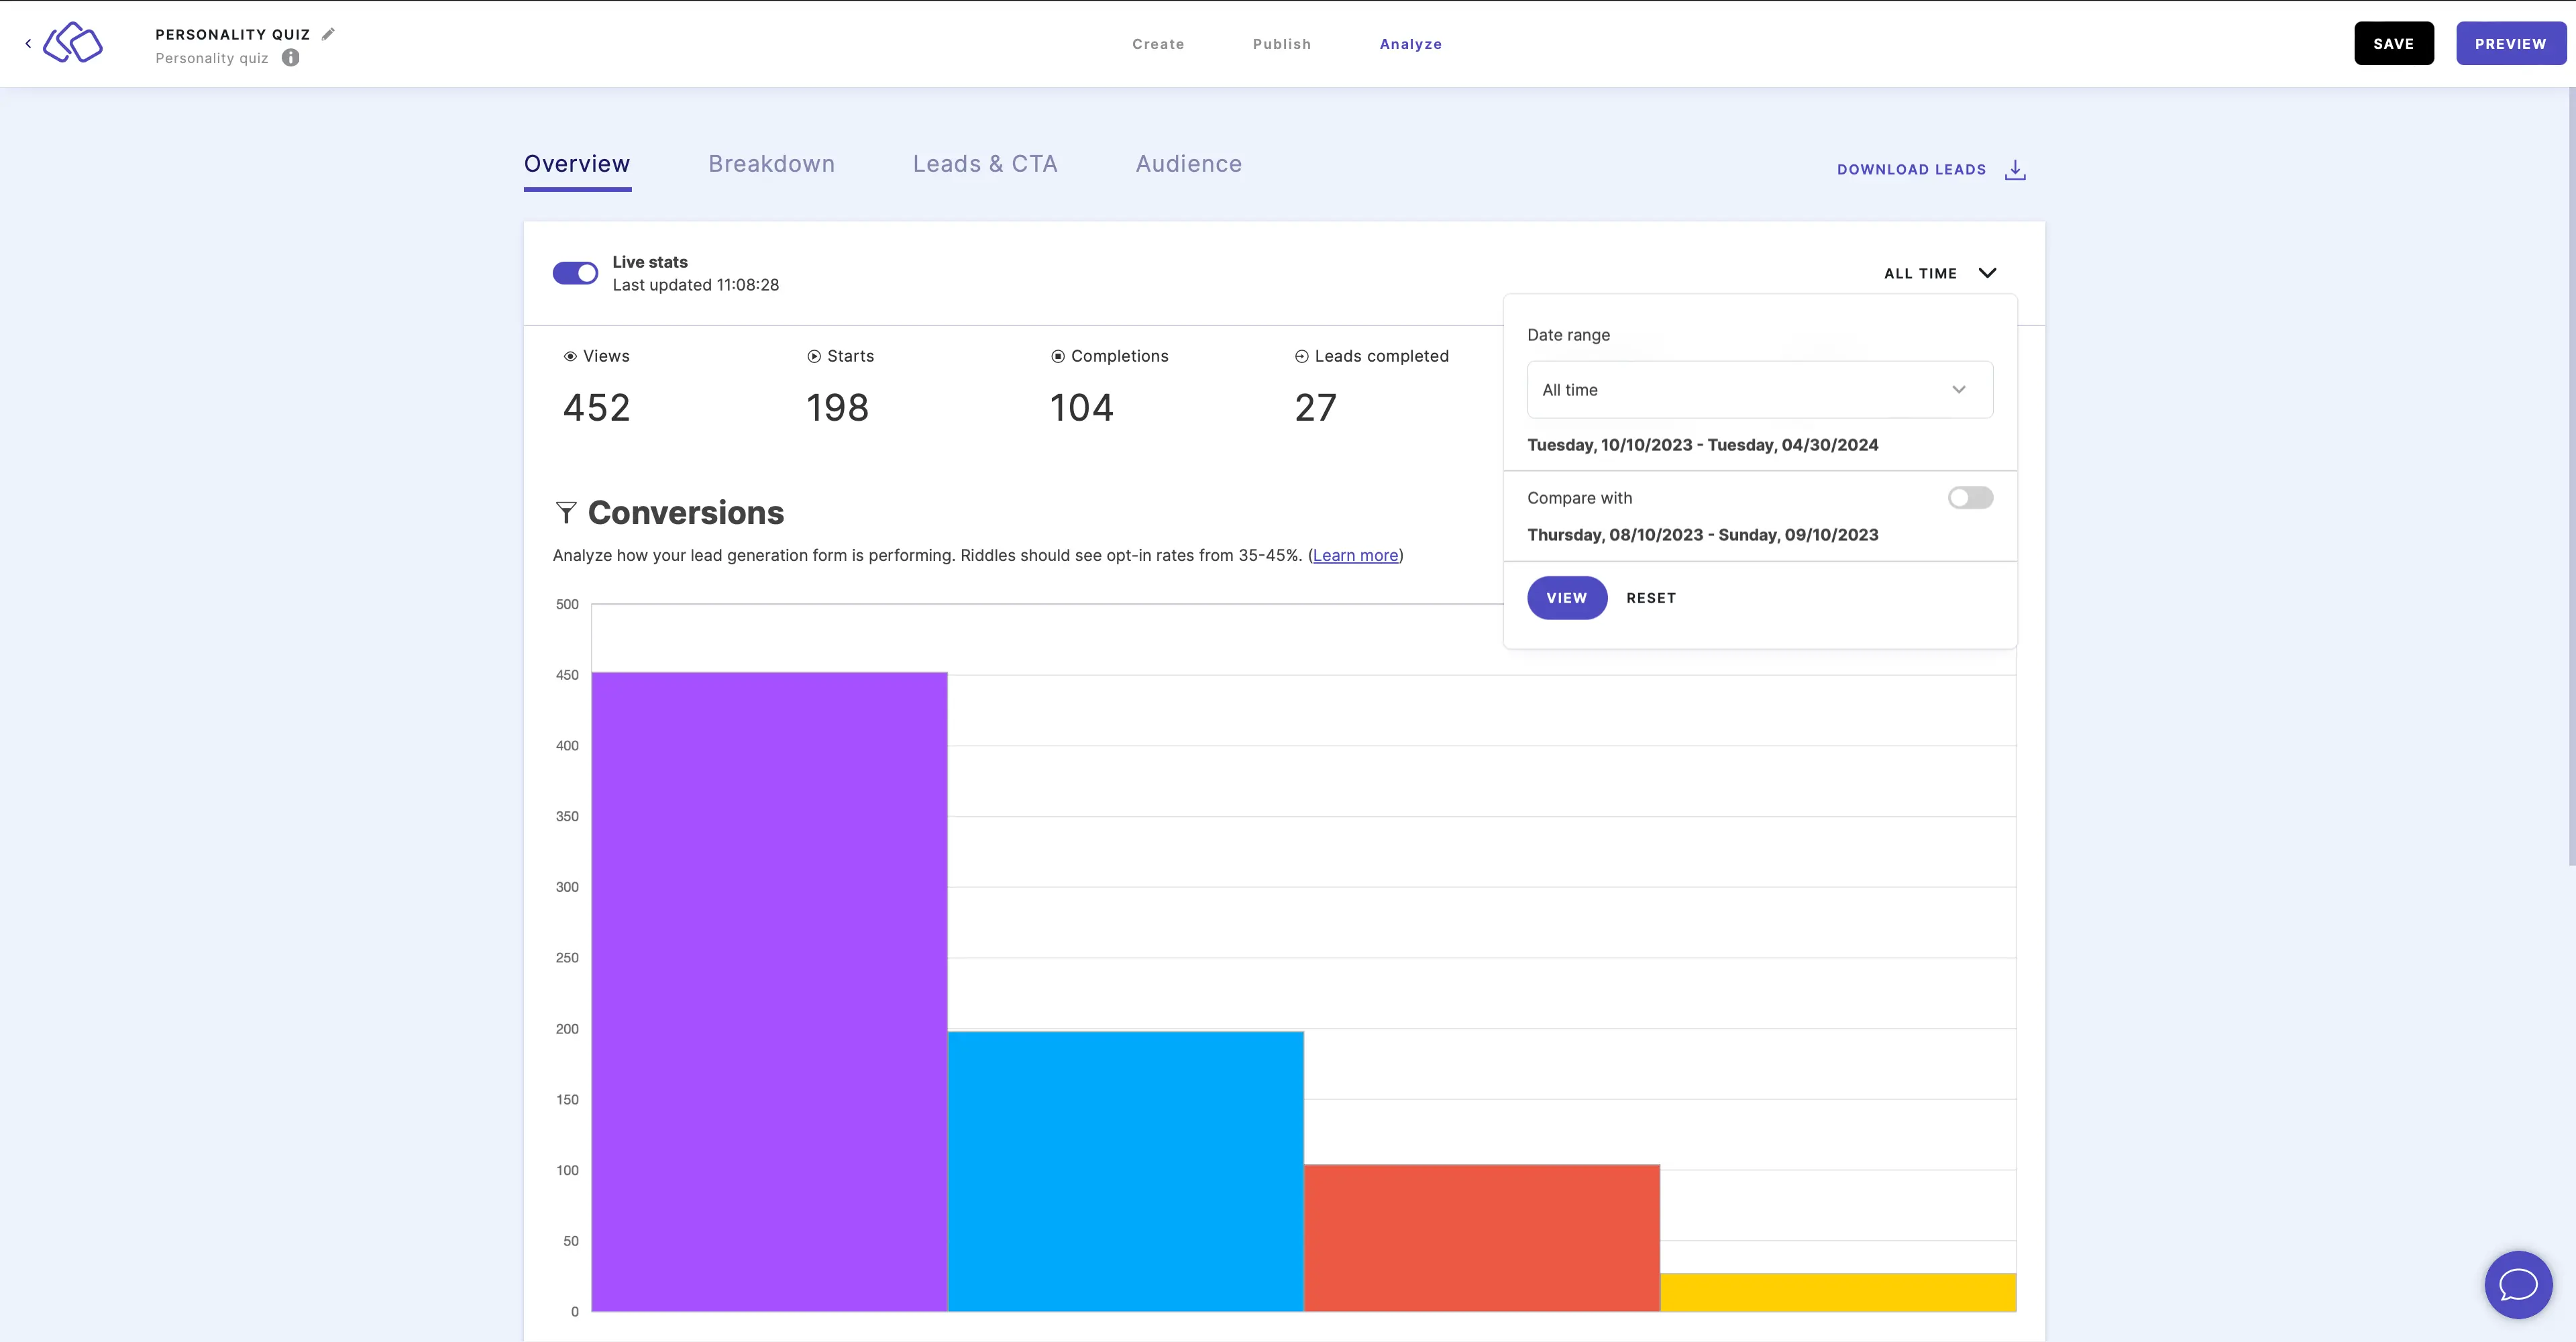
Understand conversions
Conversations are your leads, split into Lead funnel and # Leads.
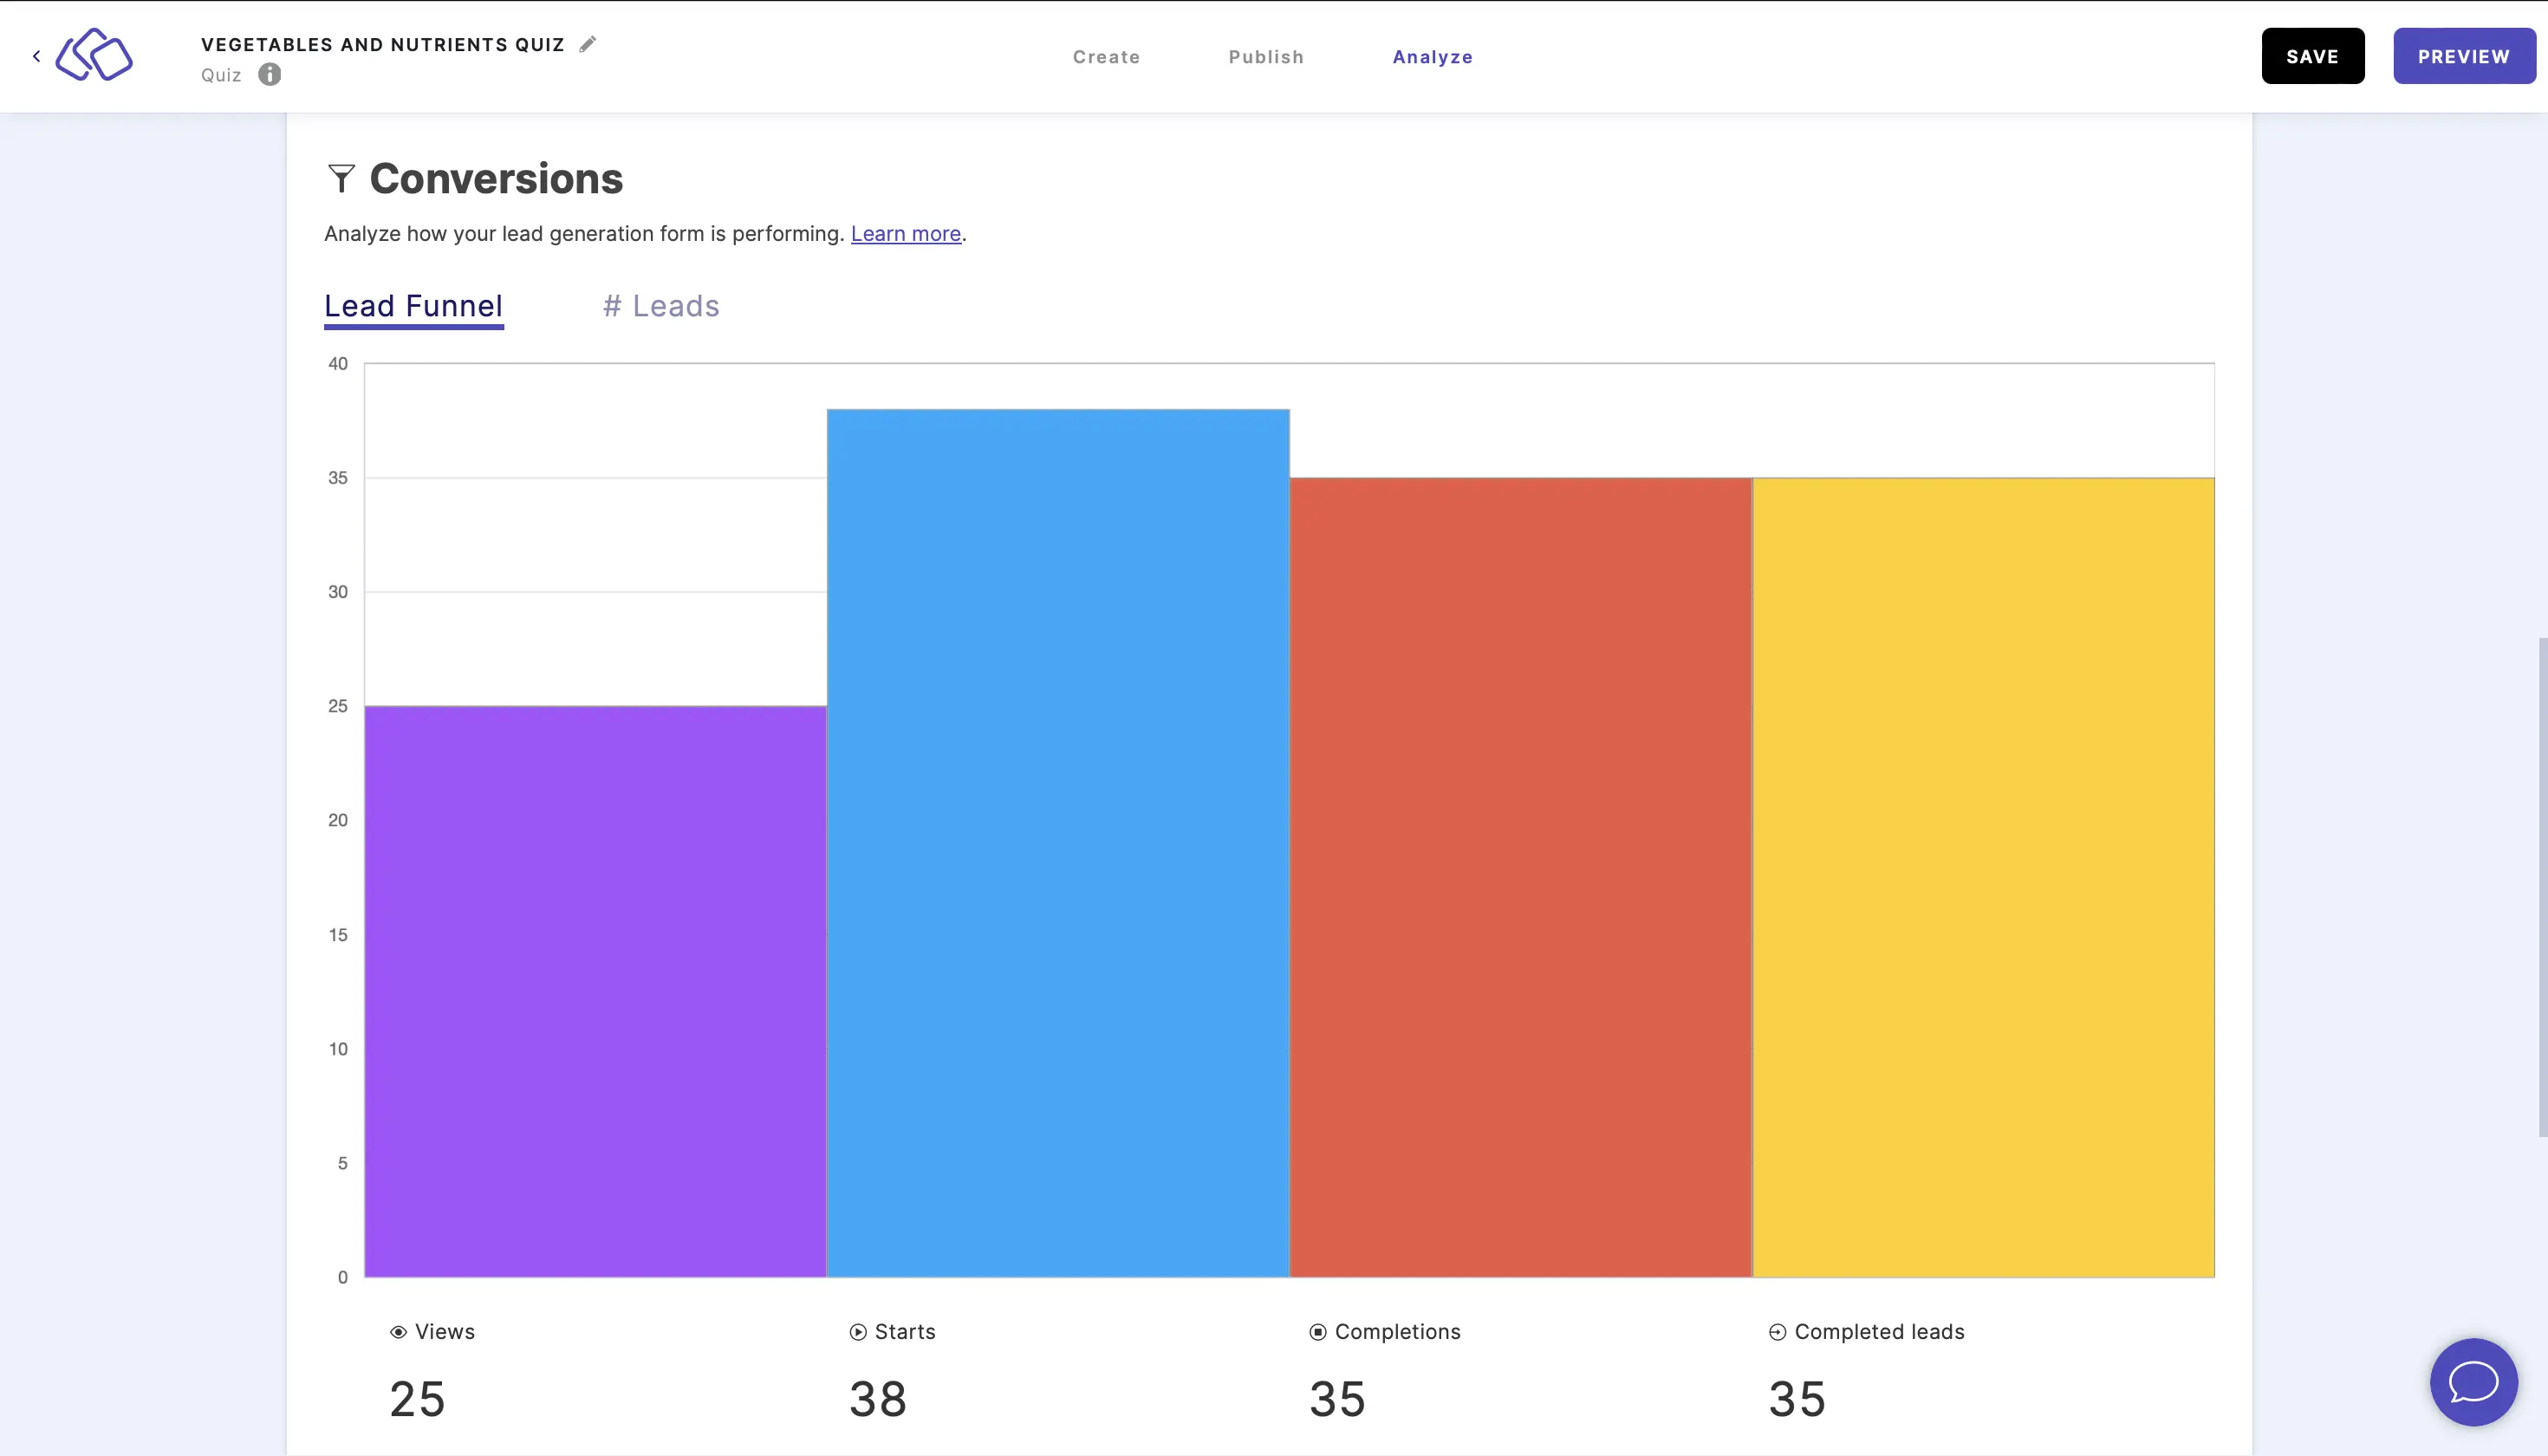
- The lead funnel shows the following statistics as a bar chart:
- Views - how often the Riddle was loaded
- Starts - how many people interacted with the first block
- Completions - how many people finished the Riddle
- Leads completed - the number of leads where every required form field and lead identifier was filled out
- # Leads show the following statistics as a stacked bar chart per day:
- Views
- Starts
- Completions
- Current leads
If you have disabled 'Skip' for your lead form blocks, the number of completions should equal the number of leads completed.
Each person that filled out all form fields is tracked as a completed lead. For more information, go to the Leads & CTA guide.
The y-axis shows the number of people scaled to suit your data. For exact numbers, hover over each bar.
In the best case, your Riddle can see opt-in rates of 20% to 40%, meaning 20% to 40% of your audience filled out their information in the form (lead) blocks so you now have this data.
Understand social sharing
Social sharing is how many people have shared their Riddle results and on which social network.
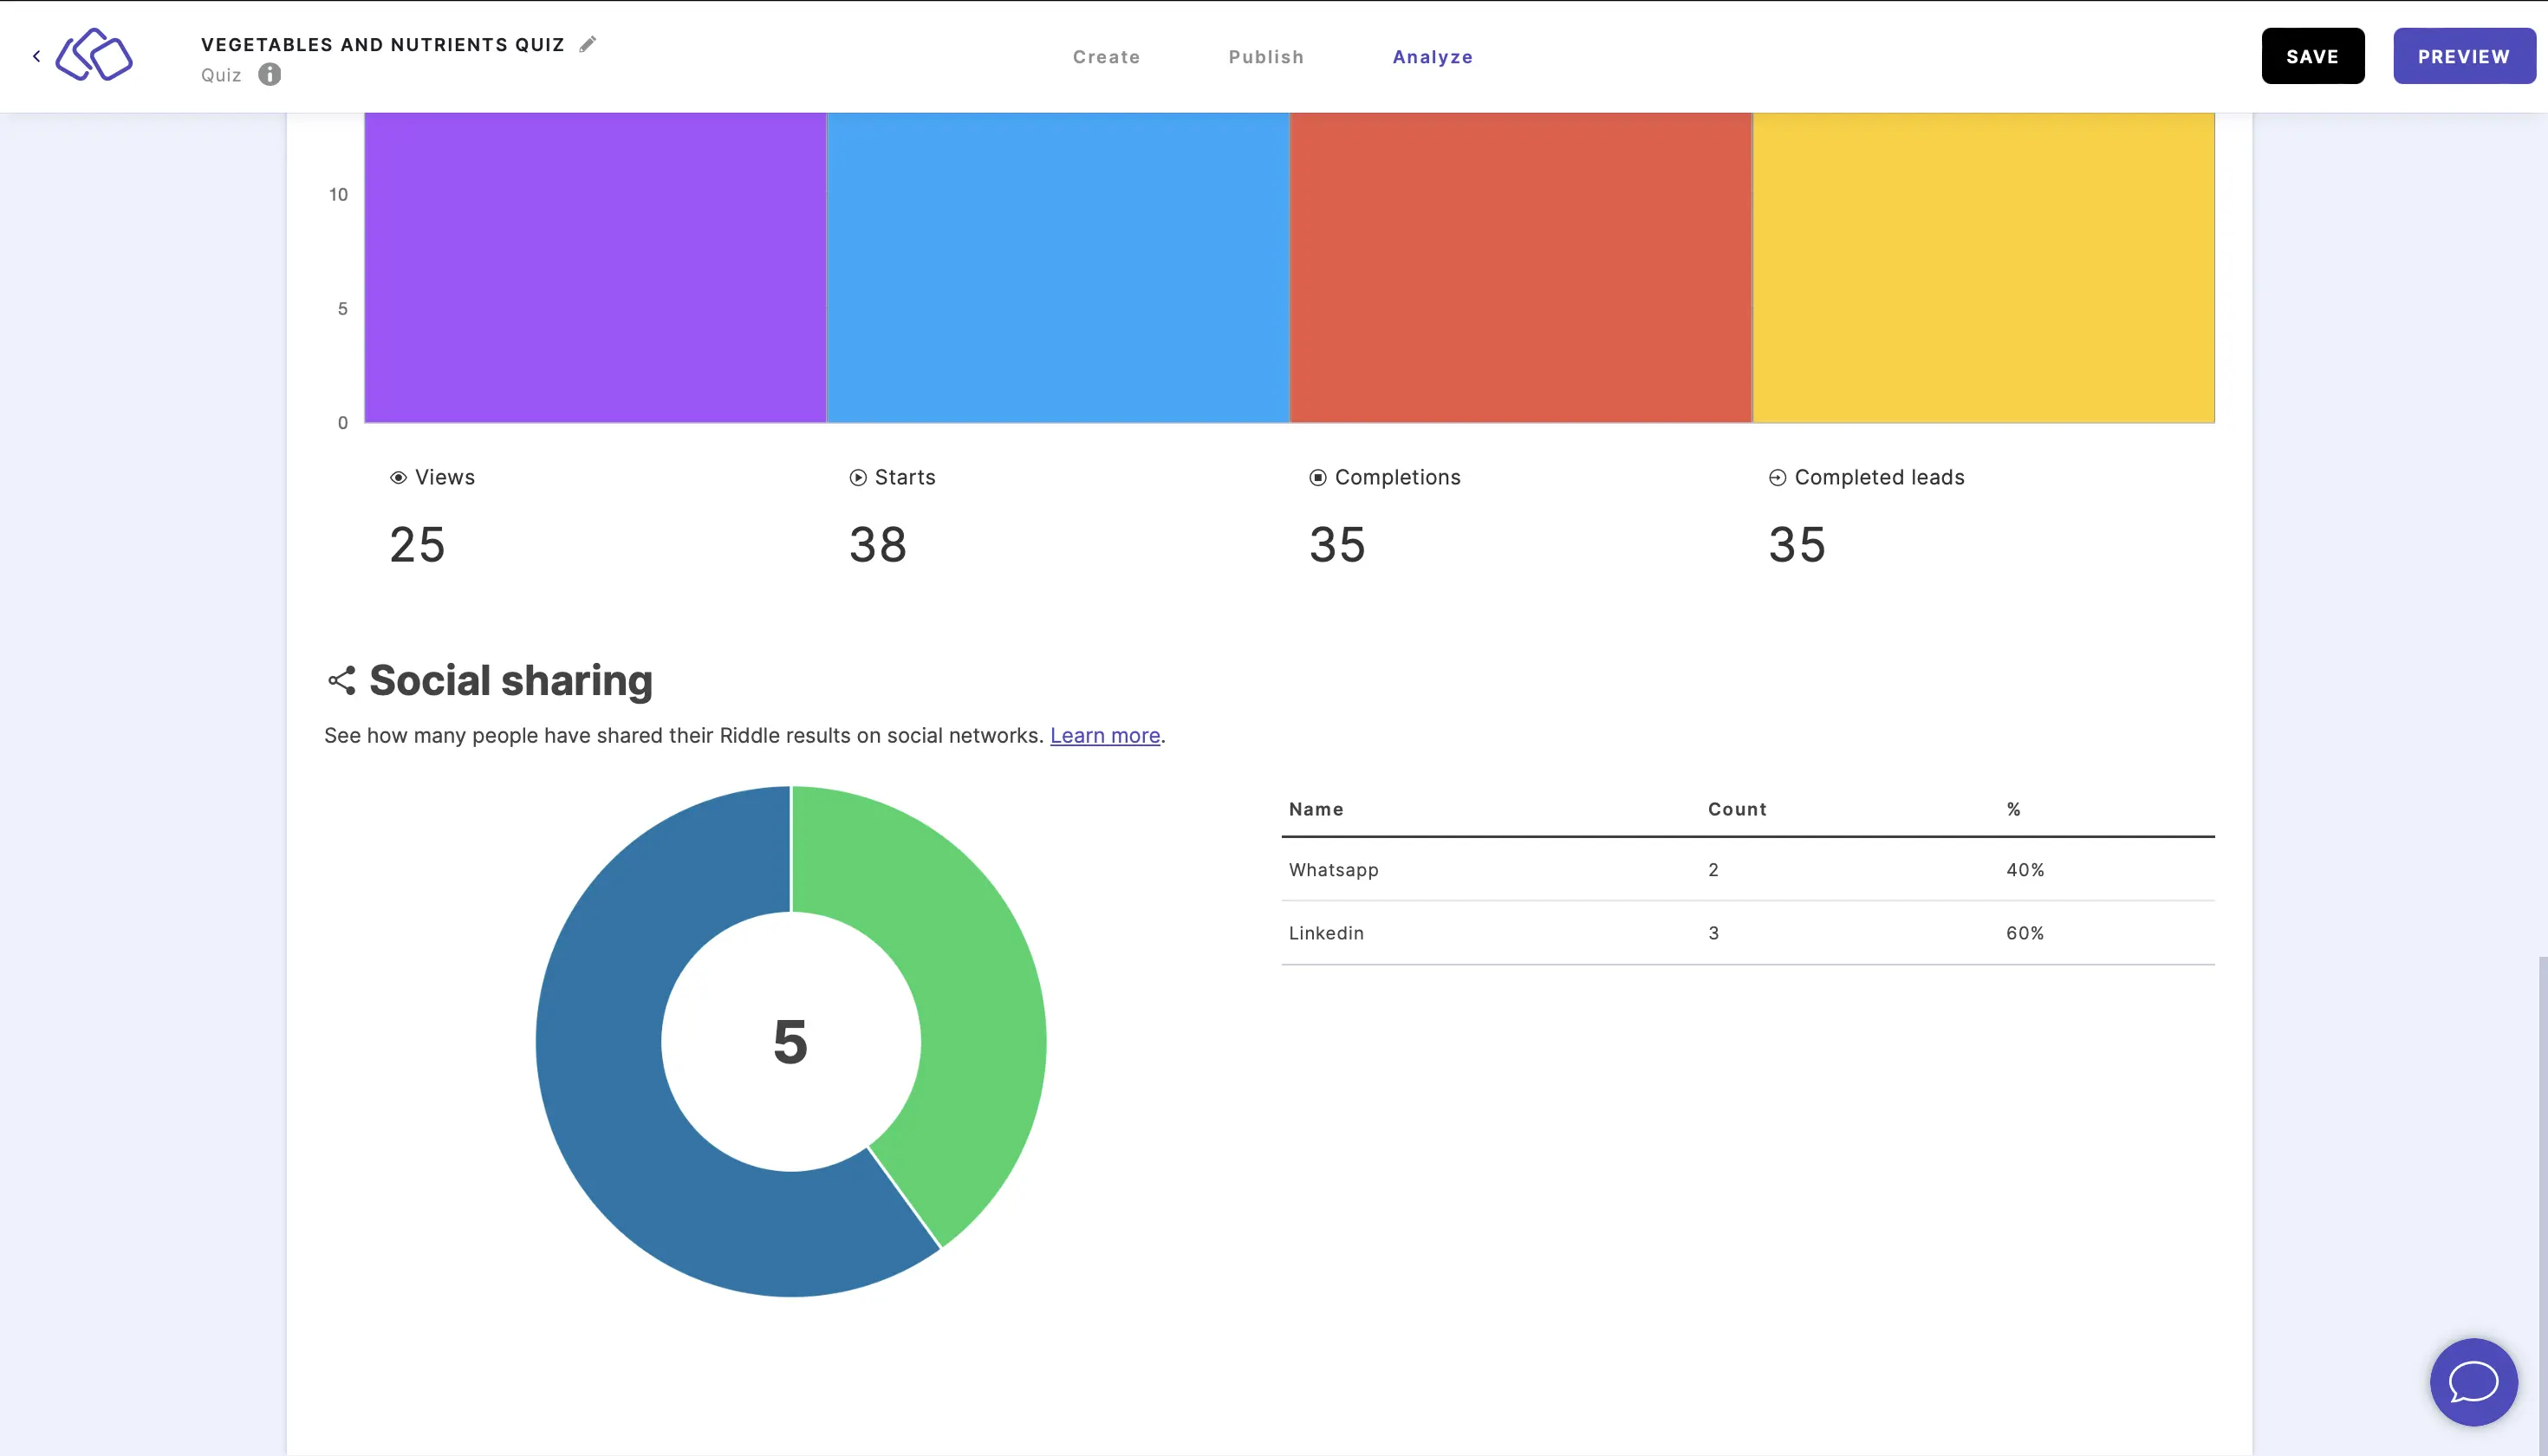
They are tracked by social network name, raw count, and percentage of your audience.
These stats are also converted into a pie chart with every color denoting a different social network.