Connect to Google Data Studio
You can use Google Data Studio to get insights about how Riddles and projects perform. You will need a Riddle.com account to operate this connector. If you don't already have an one, set up a Riddle.com account.
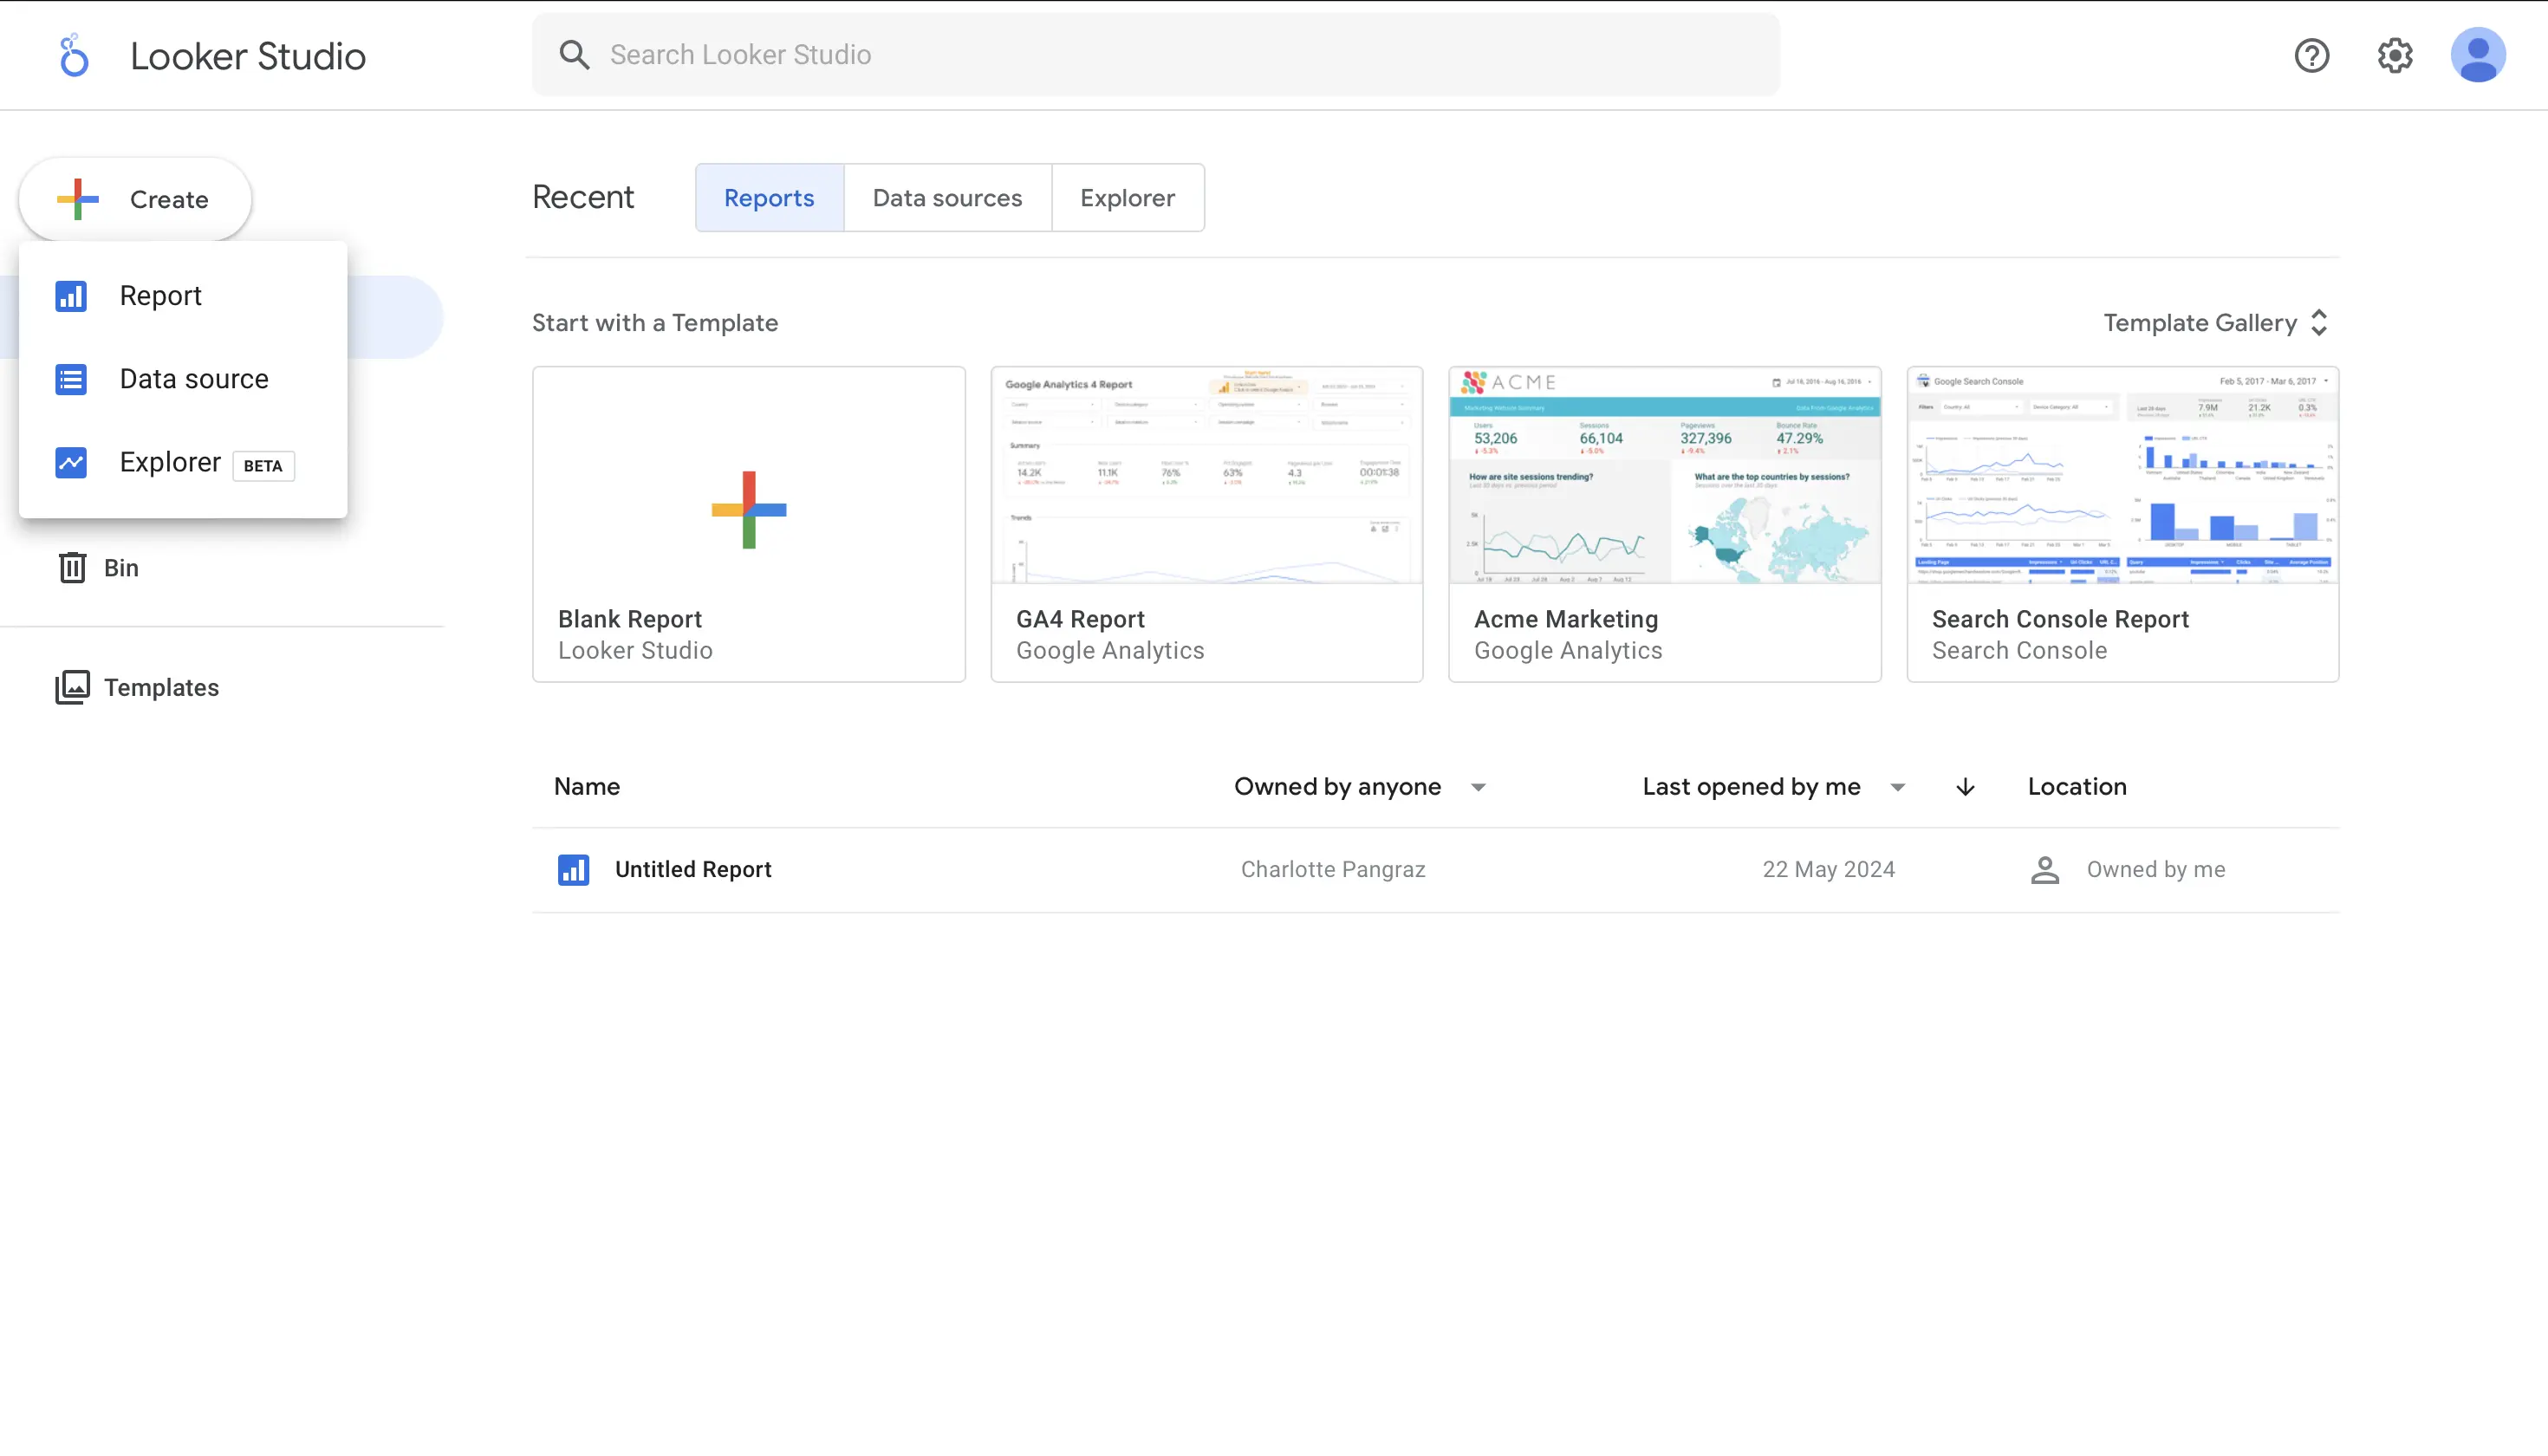
- Go to Data Studio.
- Click on Create and select Data source.
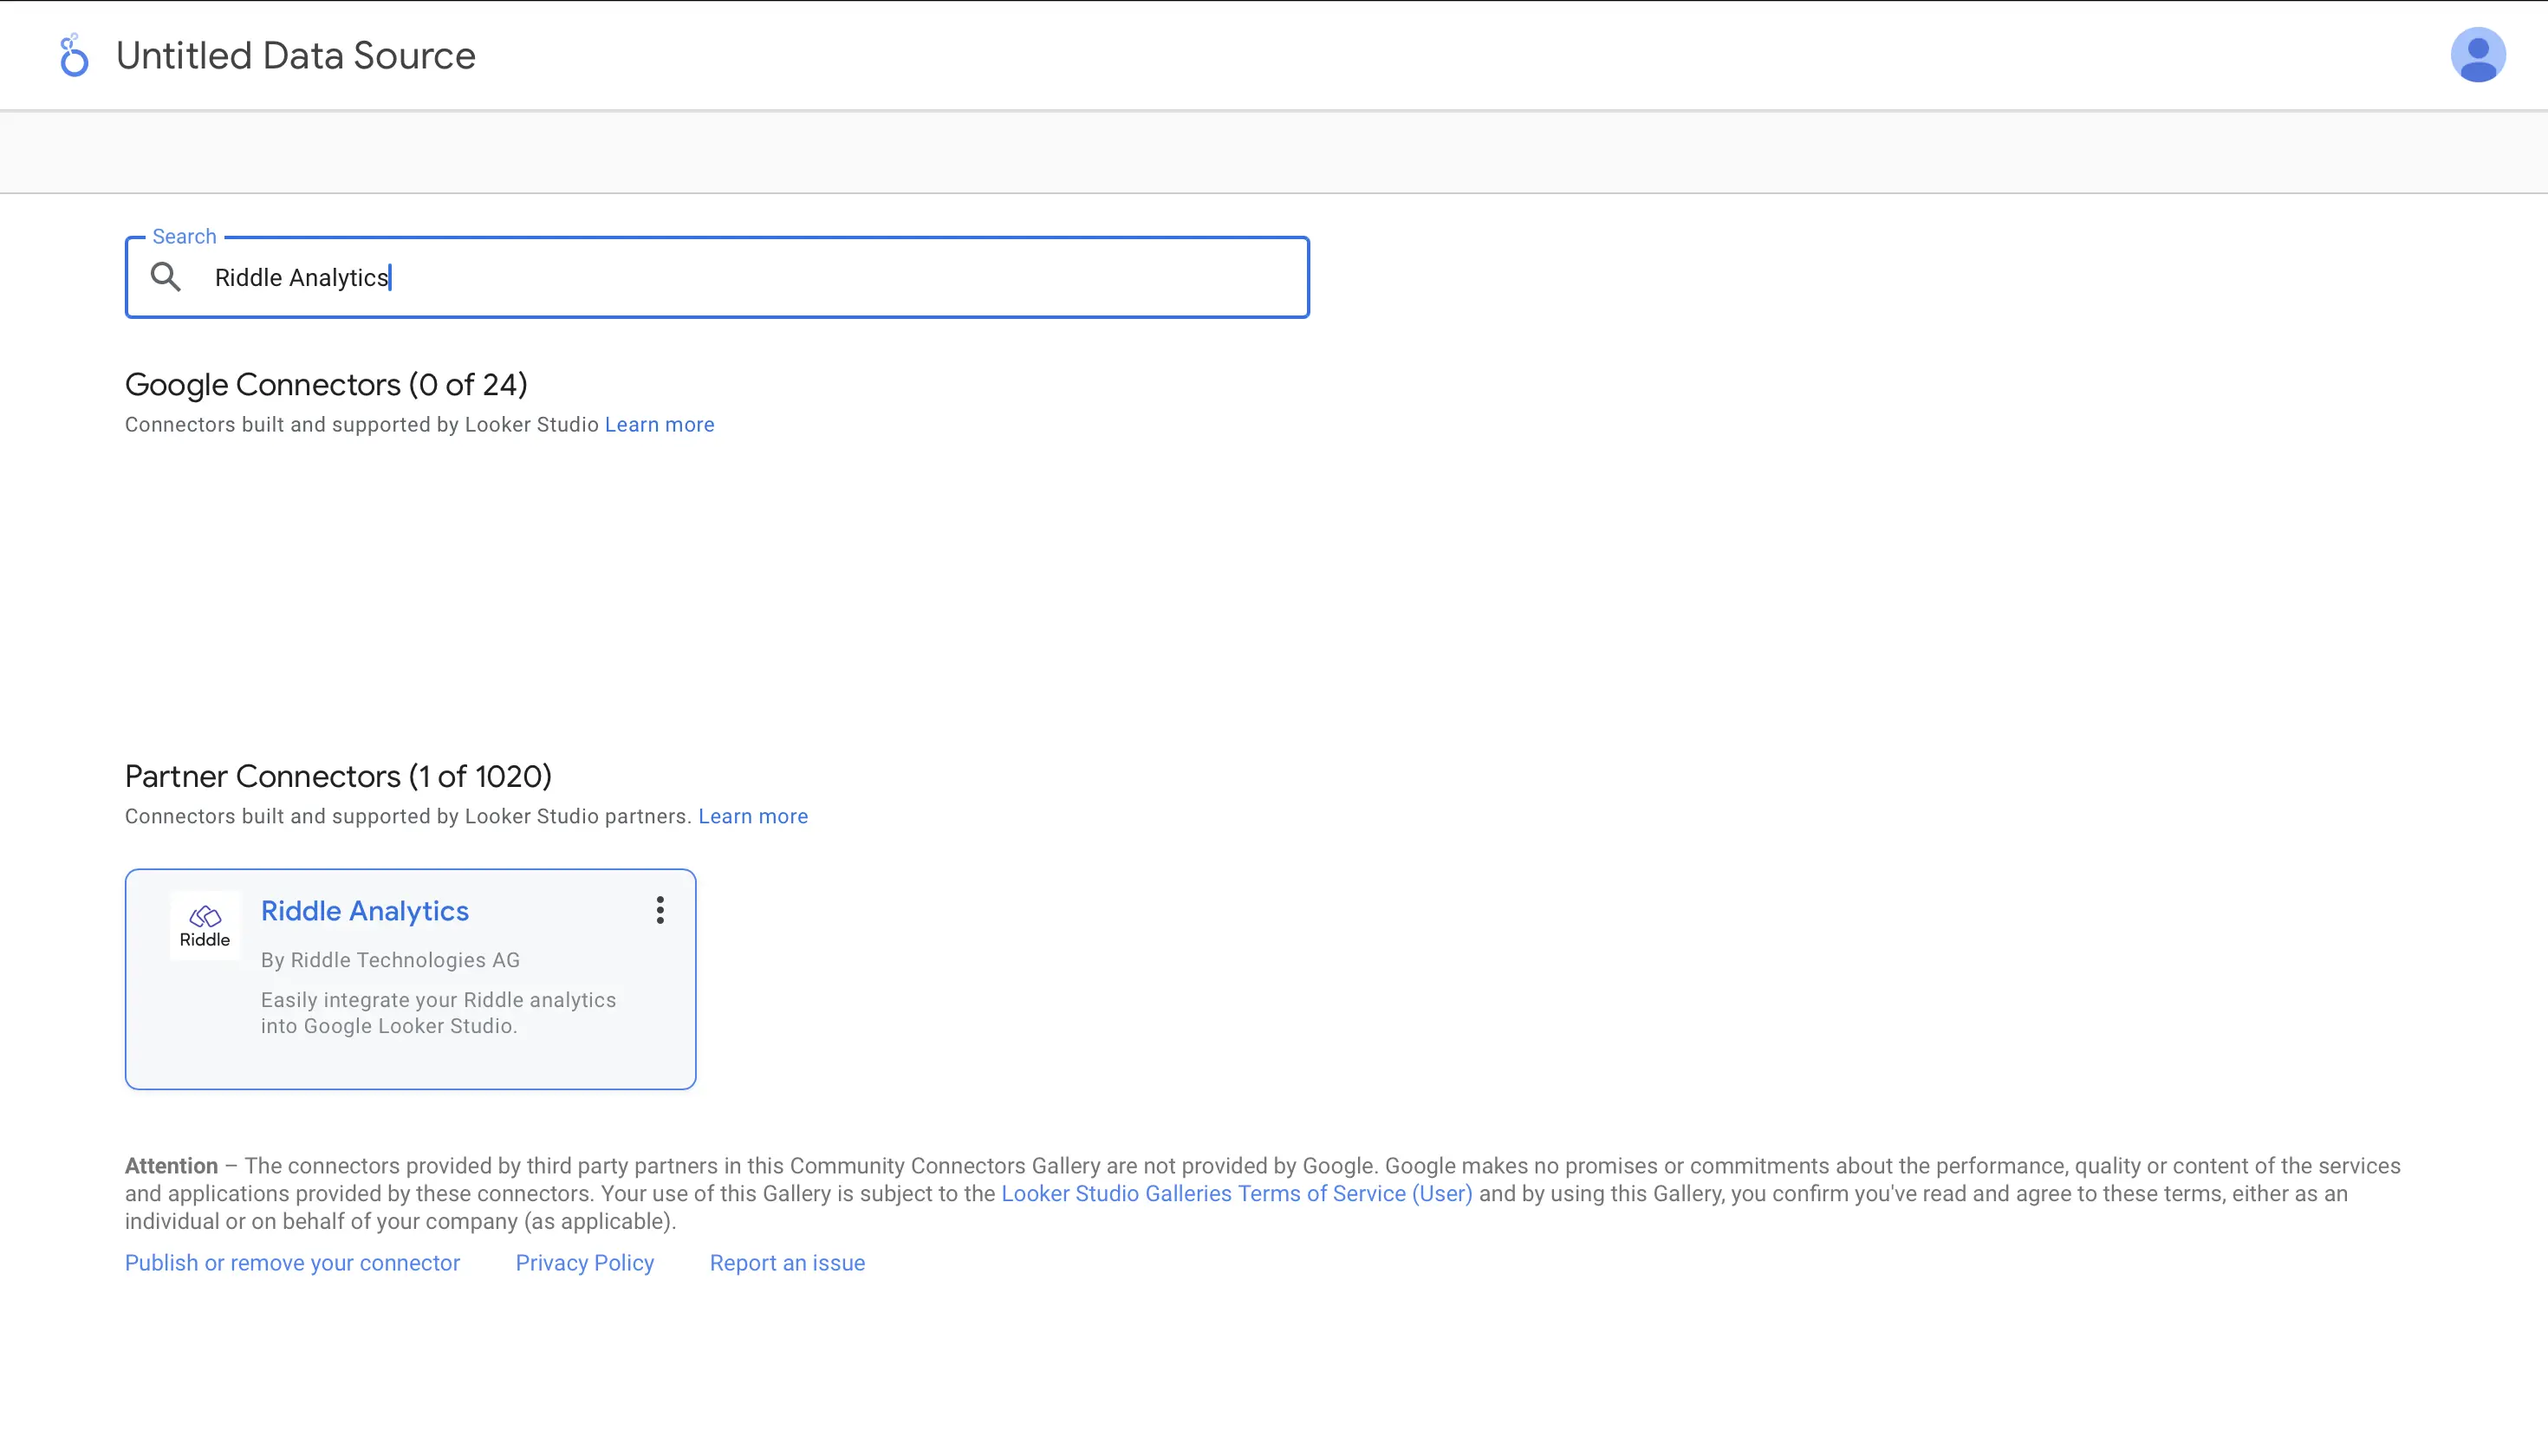
- Enter Riddle Analytics in the search bar and click on the Riddle Analytics connector.
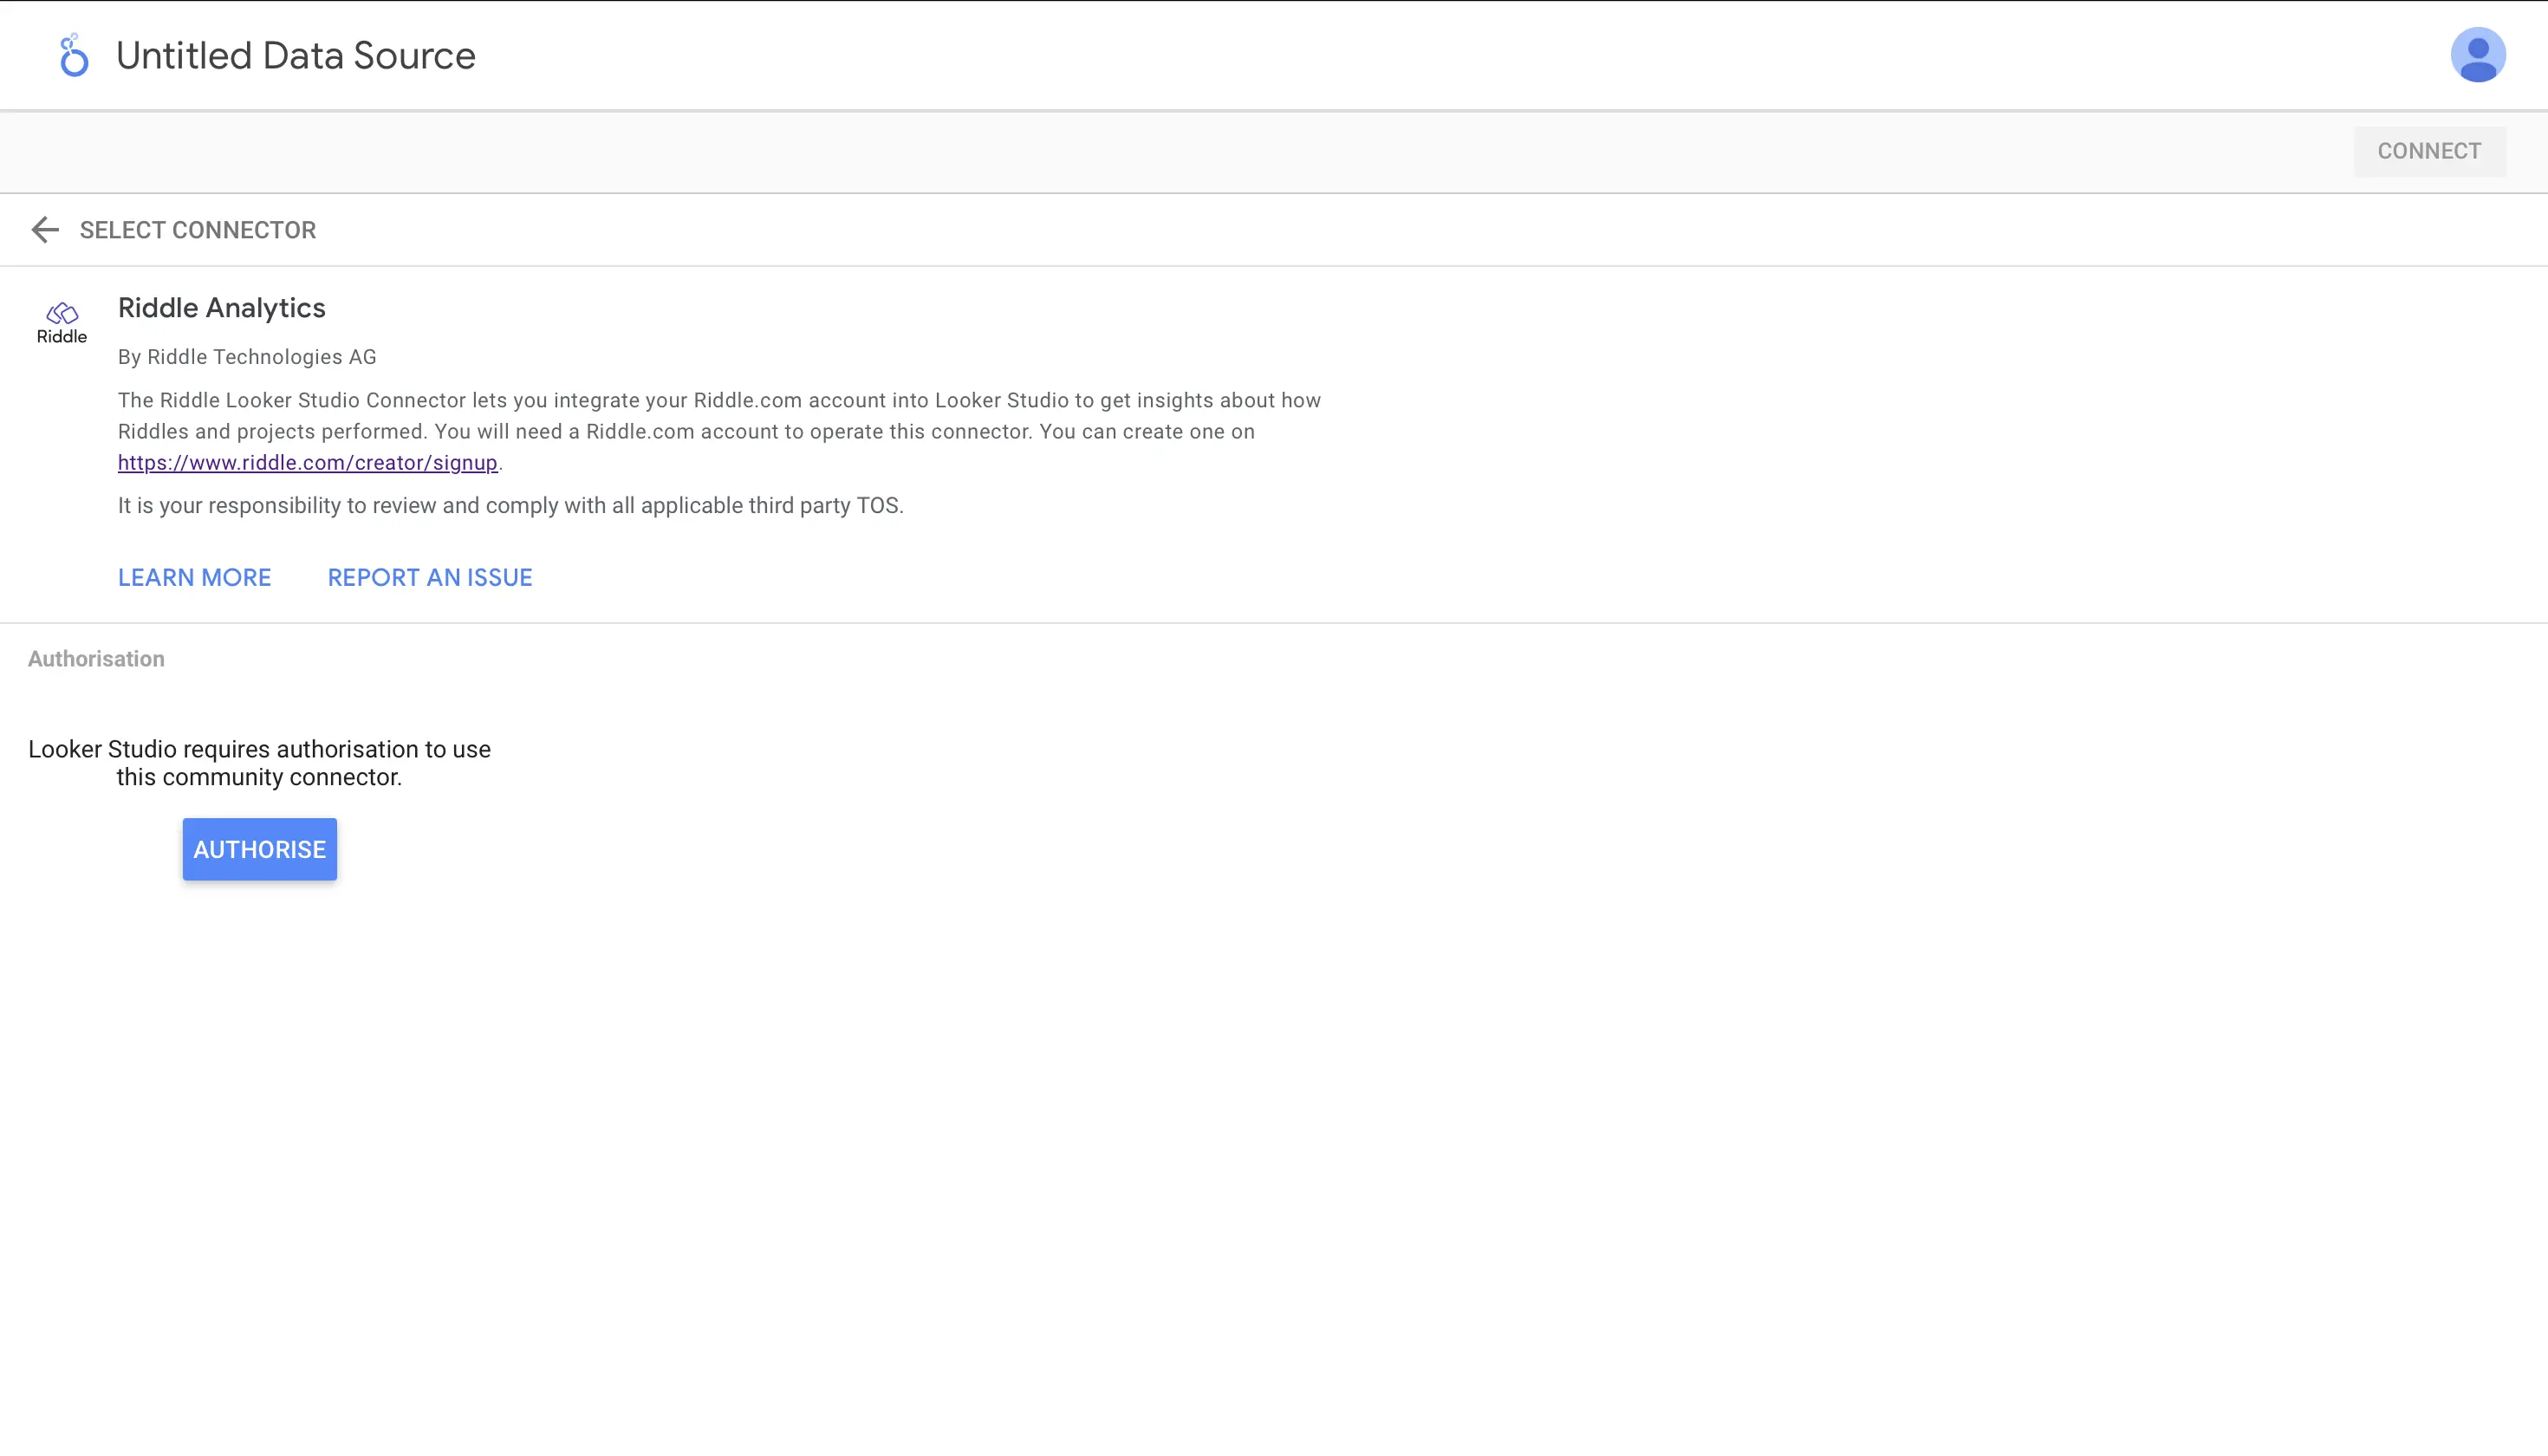
- Click on AUTHORISE.
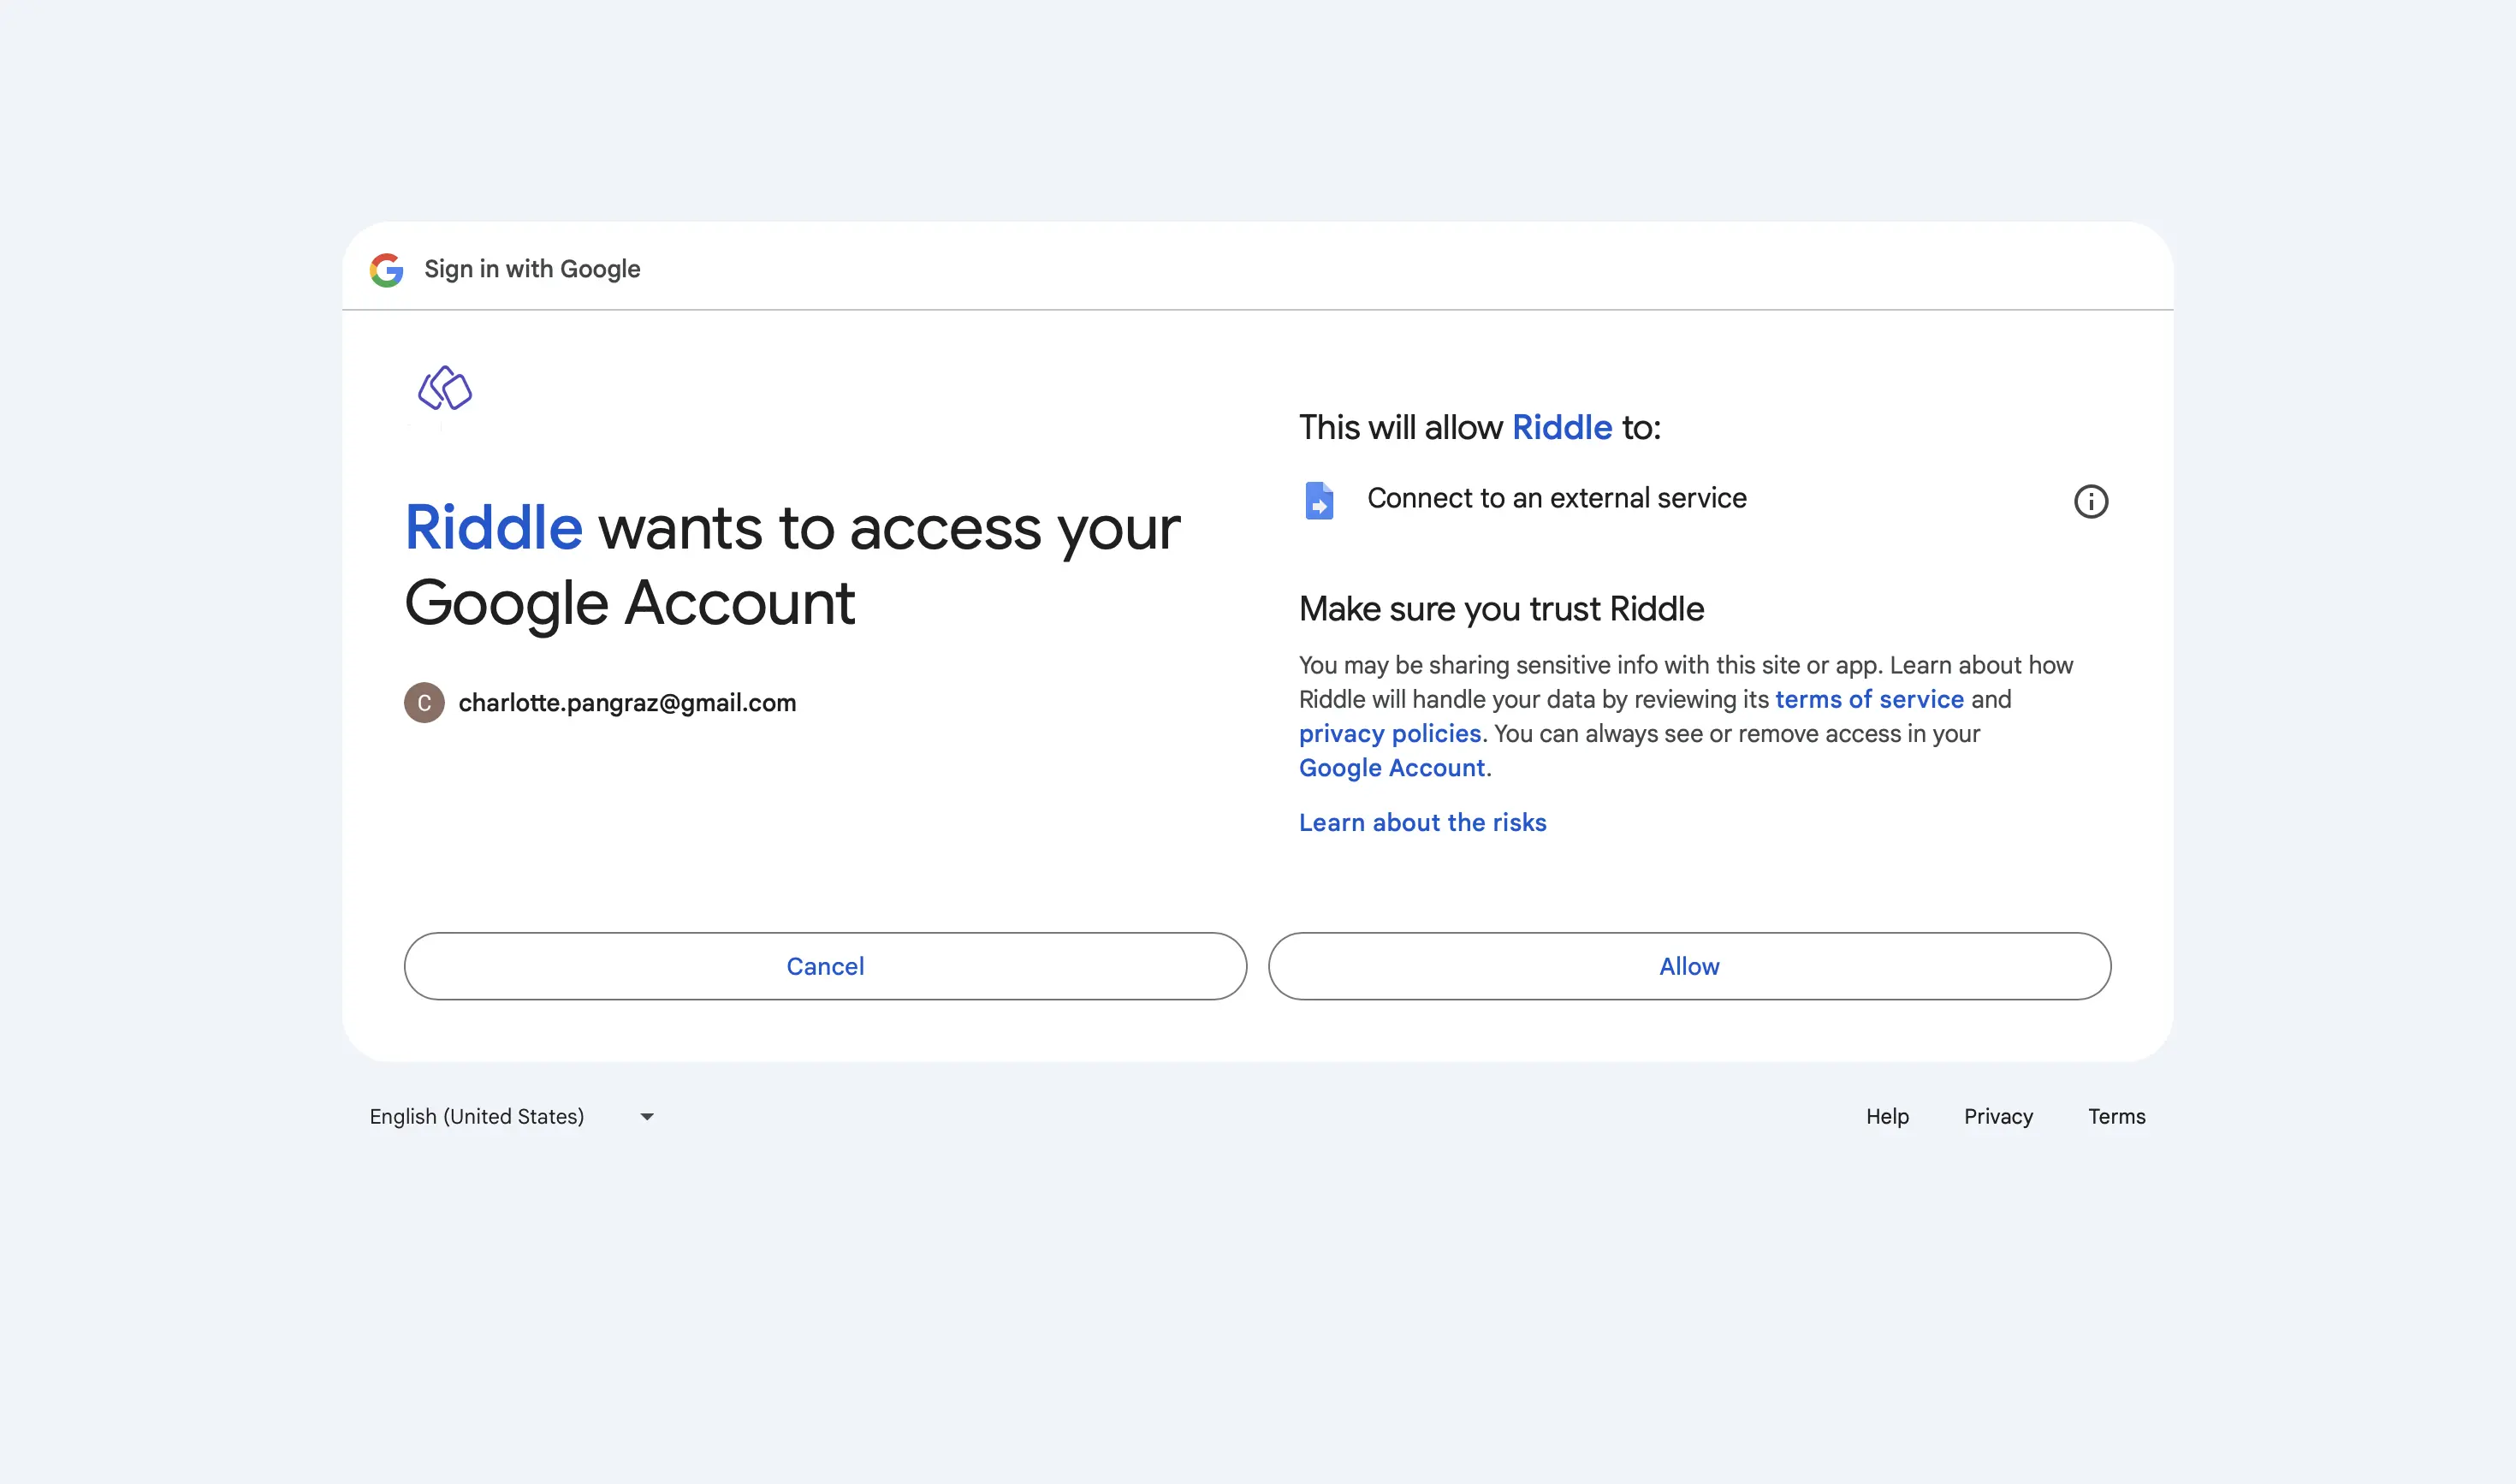
- Log in to your Google account.
- Click on Allow.
- In the new window that appears, log in to your Riddle.com account if you are not already logged in.
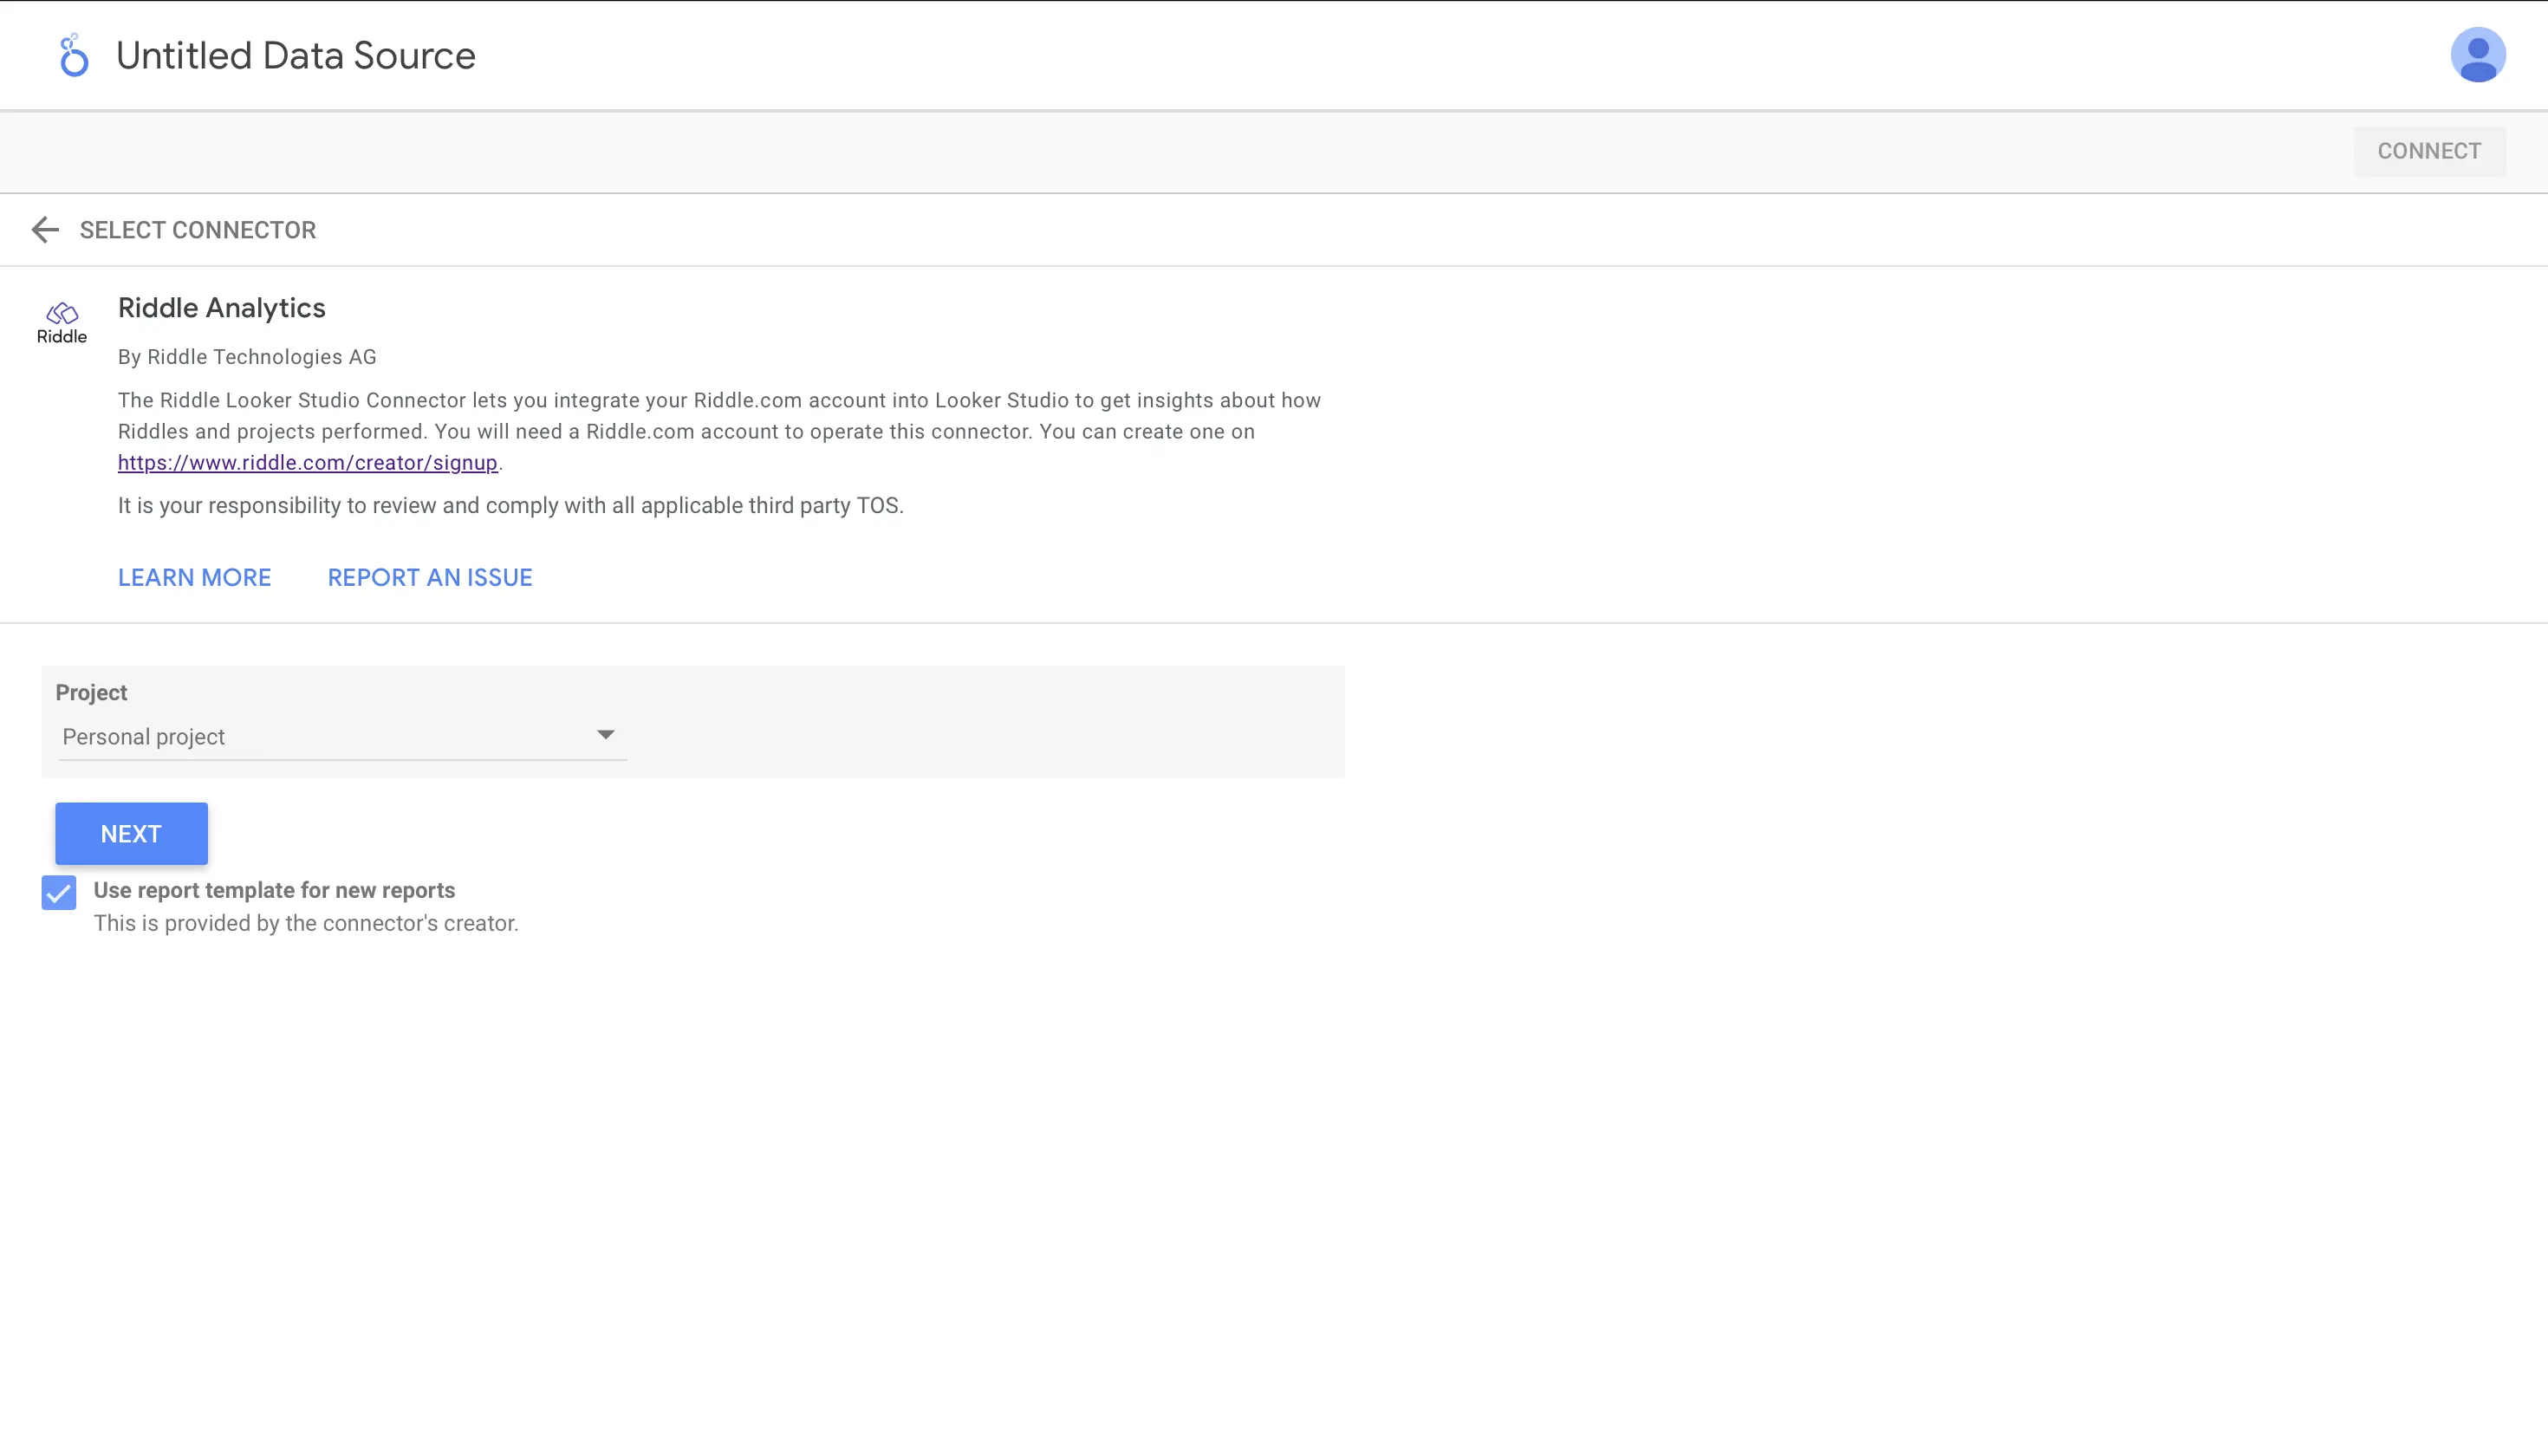
- Select a project from the dropdown list, choosing Personal project to gain access to all projects, or All projects + personal project to gain access to all Riddles in your account, later on, and click on NEXT.
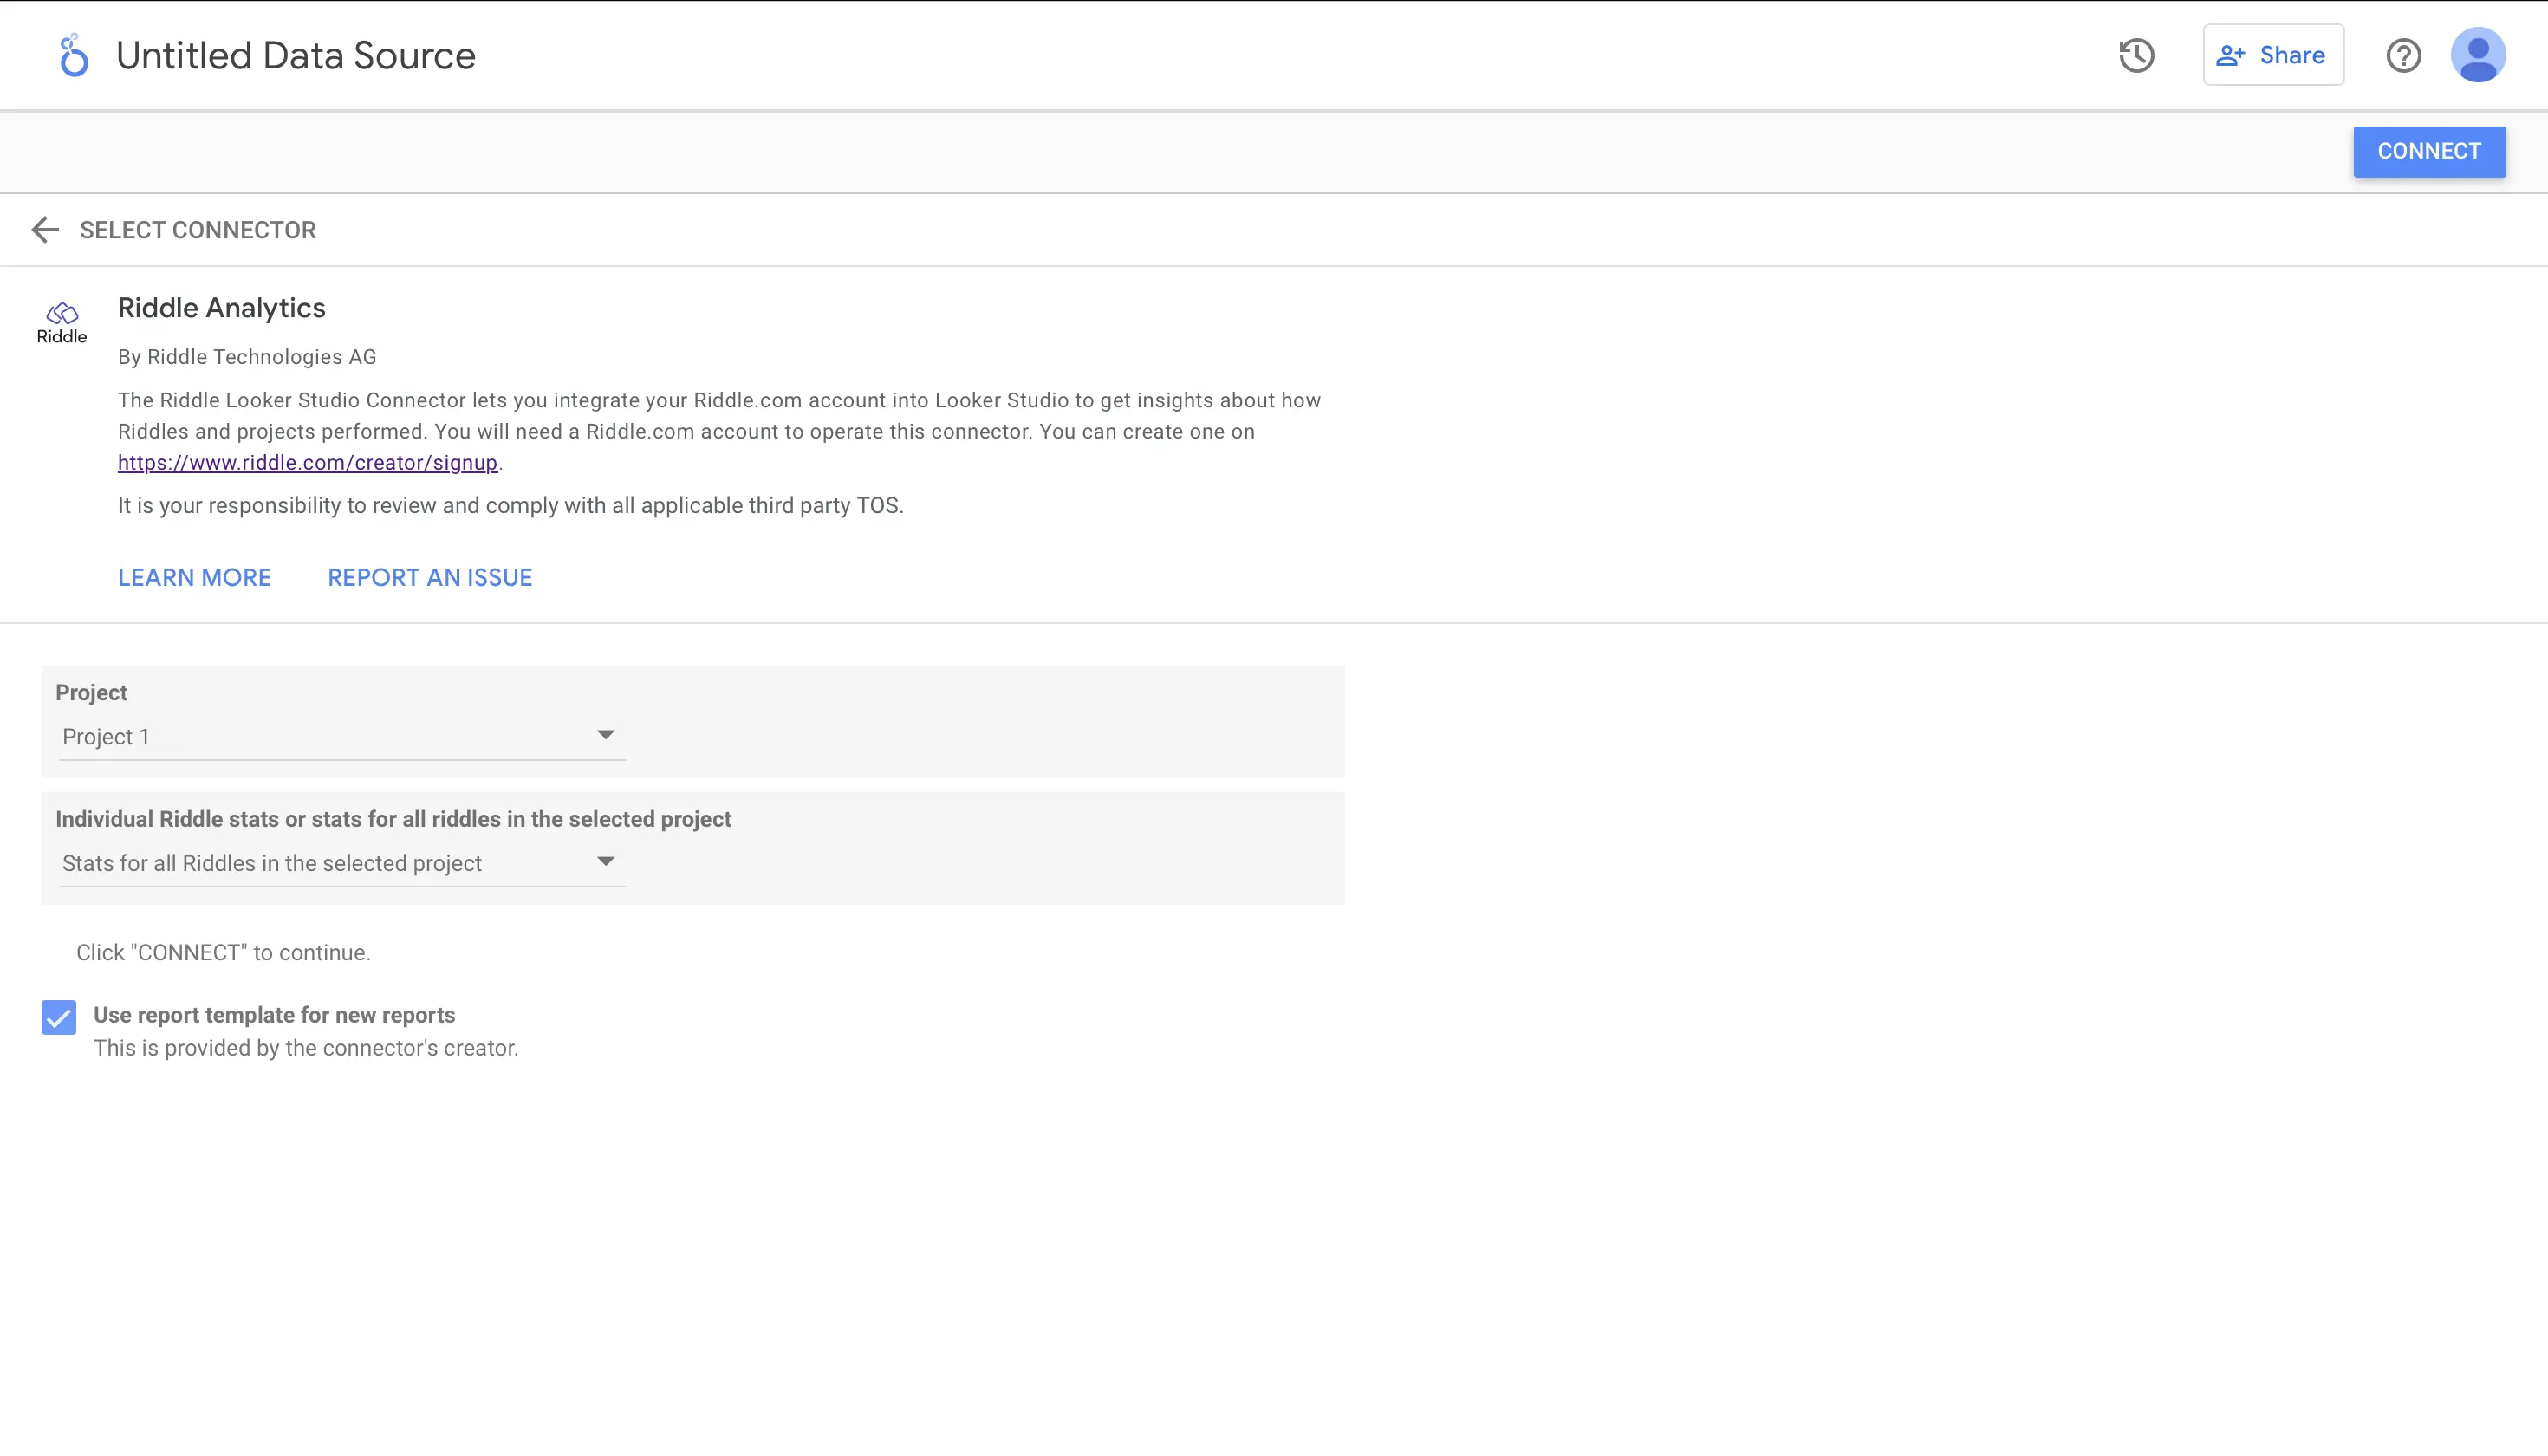
- Select a Riddle title or Stats for all Riddles in the selected project from the dropdown menu, and click on CONNECT top right.
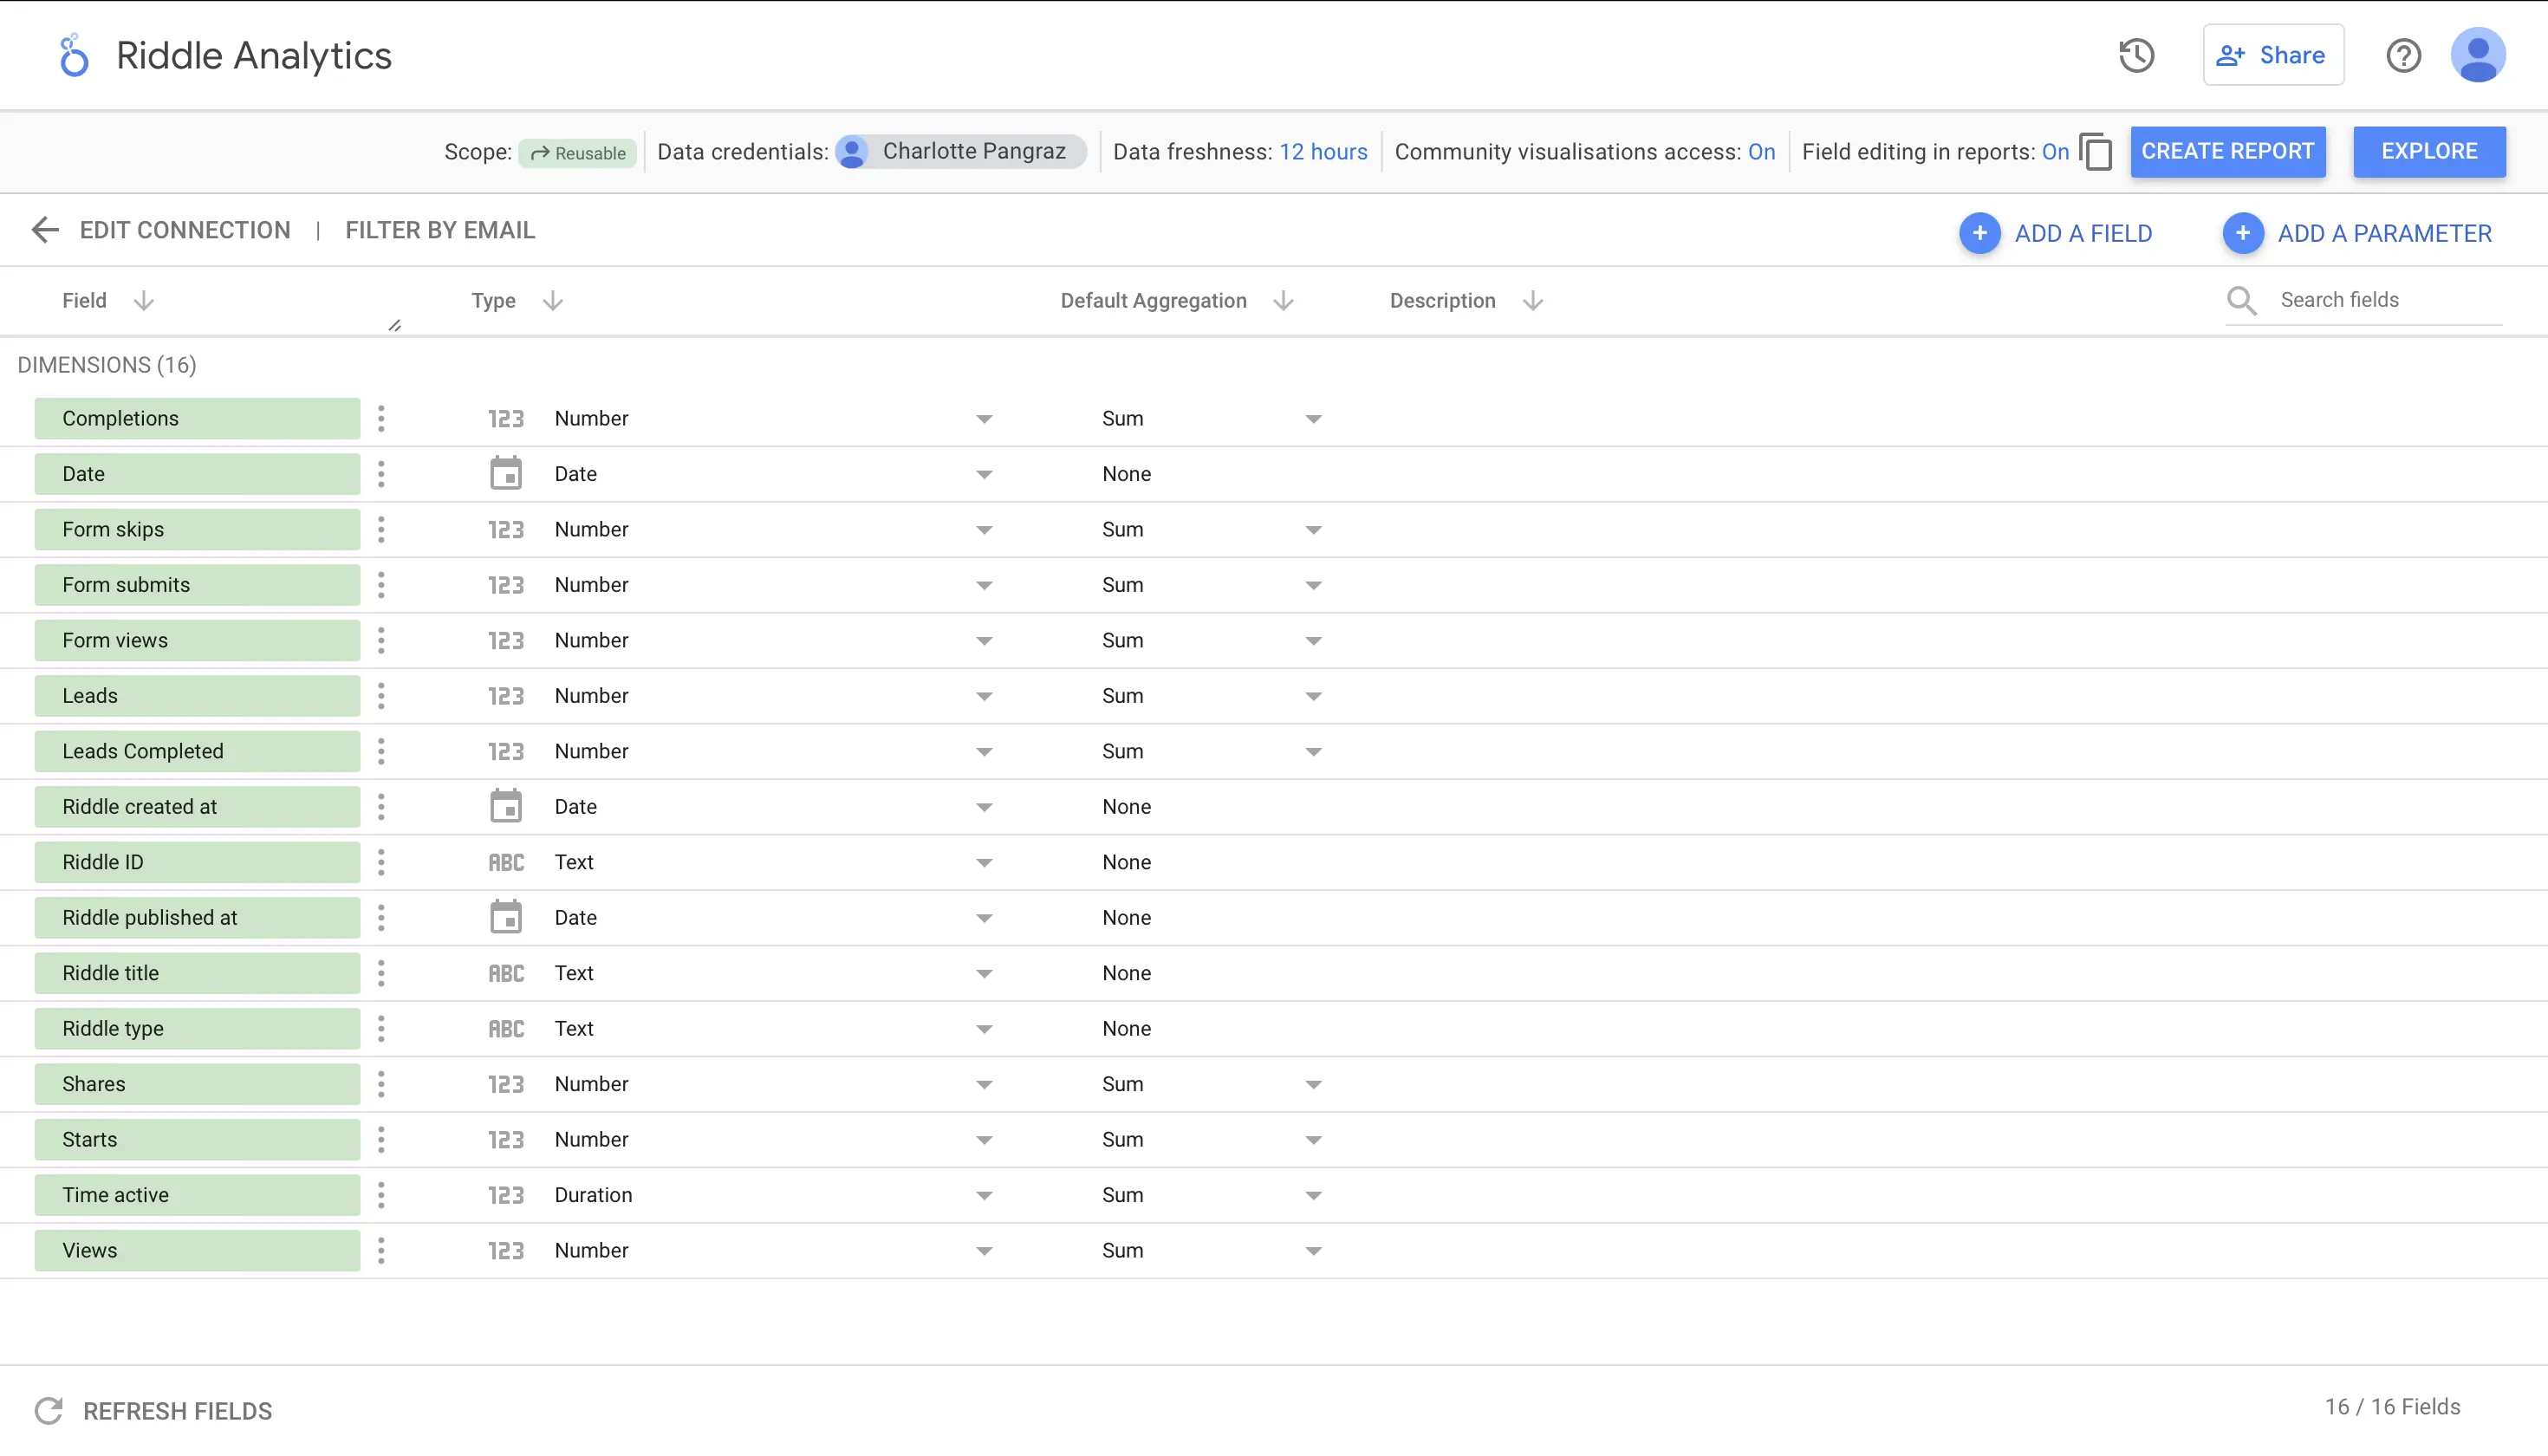
- Click on CREATE REPORT to create a default report.
 11. Learn more about how to work with Data Studio to add to, view, and share your reports.
Peak Concurrent Users
You can analyze Peak Concurrent Users in Data Studio for deeper insights into simultaneous user activity. Peak Concurrent Users shows the maximum number of users who were actively viewing or playing your Riddle at the same time.
Available modes
The Peak Concurrent Users metric can be analyzed in three different modes, depending on which fields you select:
1. Global Concurrent Users Max Mode
This mode provides statistics on a global basis across all your Riddles.
- Triggered when: Only Date and Peak Concurrent Users fields are selected (no Project or Riddle fields)
- Supported fields:
- Date (to split data by day)
- Peak Concurrent Users
- Use case: Understand overall peak engagement across your entire account
2. Project Stats
This mode provides statistics on a team/project basis.
- Triggered when: Only Project and Metric fields are selected (no Riddle fields)
- Supported fields:
- Project
- Peak Concurrent Users
- Date (optional, to split by day)
- Use case: Compare peak engagement across different projects or teams
3. Riddle Stats
This mode provides statistics on an individual Riddle basis.
- Triggered when: A Riddle field is present OR no Project field is present
- Aggregation: This mode aggregates all Riddles that match the Data Source (all project Riddles + personal project Riddles)
- Supported fields:
- Riddle (optional, to filter specific Riddles)
- Peak Concurrent Users
- Date (optional, to split by day)
- Use case: Analyze peak engagement for specific Riddles or compare performance across individual pieces of content
How to configure
- After connecting your data source, click on CREATE REPORT or open an existing report.
- Add a chart (e.g., Time Series, Table, or Scorecard).
- In the Data panel, add the Peak Concurrent Users metric.
- Add dimension fields based on the mode you want:
- Global mode: Add only Date (optional) and Peak Concurrent Users
- Project mode: Add Project and Peak Concurrent Users (and optionally Date)
- Riddle mode: Add Riddle (optional) and Peak Concurrent Users (and optionally Date)
- Customize your visualization to show trends, comparisons, or specific time periods.
Tip: Use Date as a dimension to see how Peak Concurrent Users changes over time, helping you identify patterns and peak engagement moments.