Leads & CTA
You can analyze every aspect of your lead generation form performance and see how effective your call to action buttons are. Leads are tracked as soon as you include any form block.
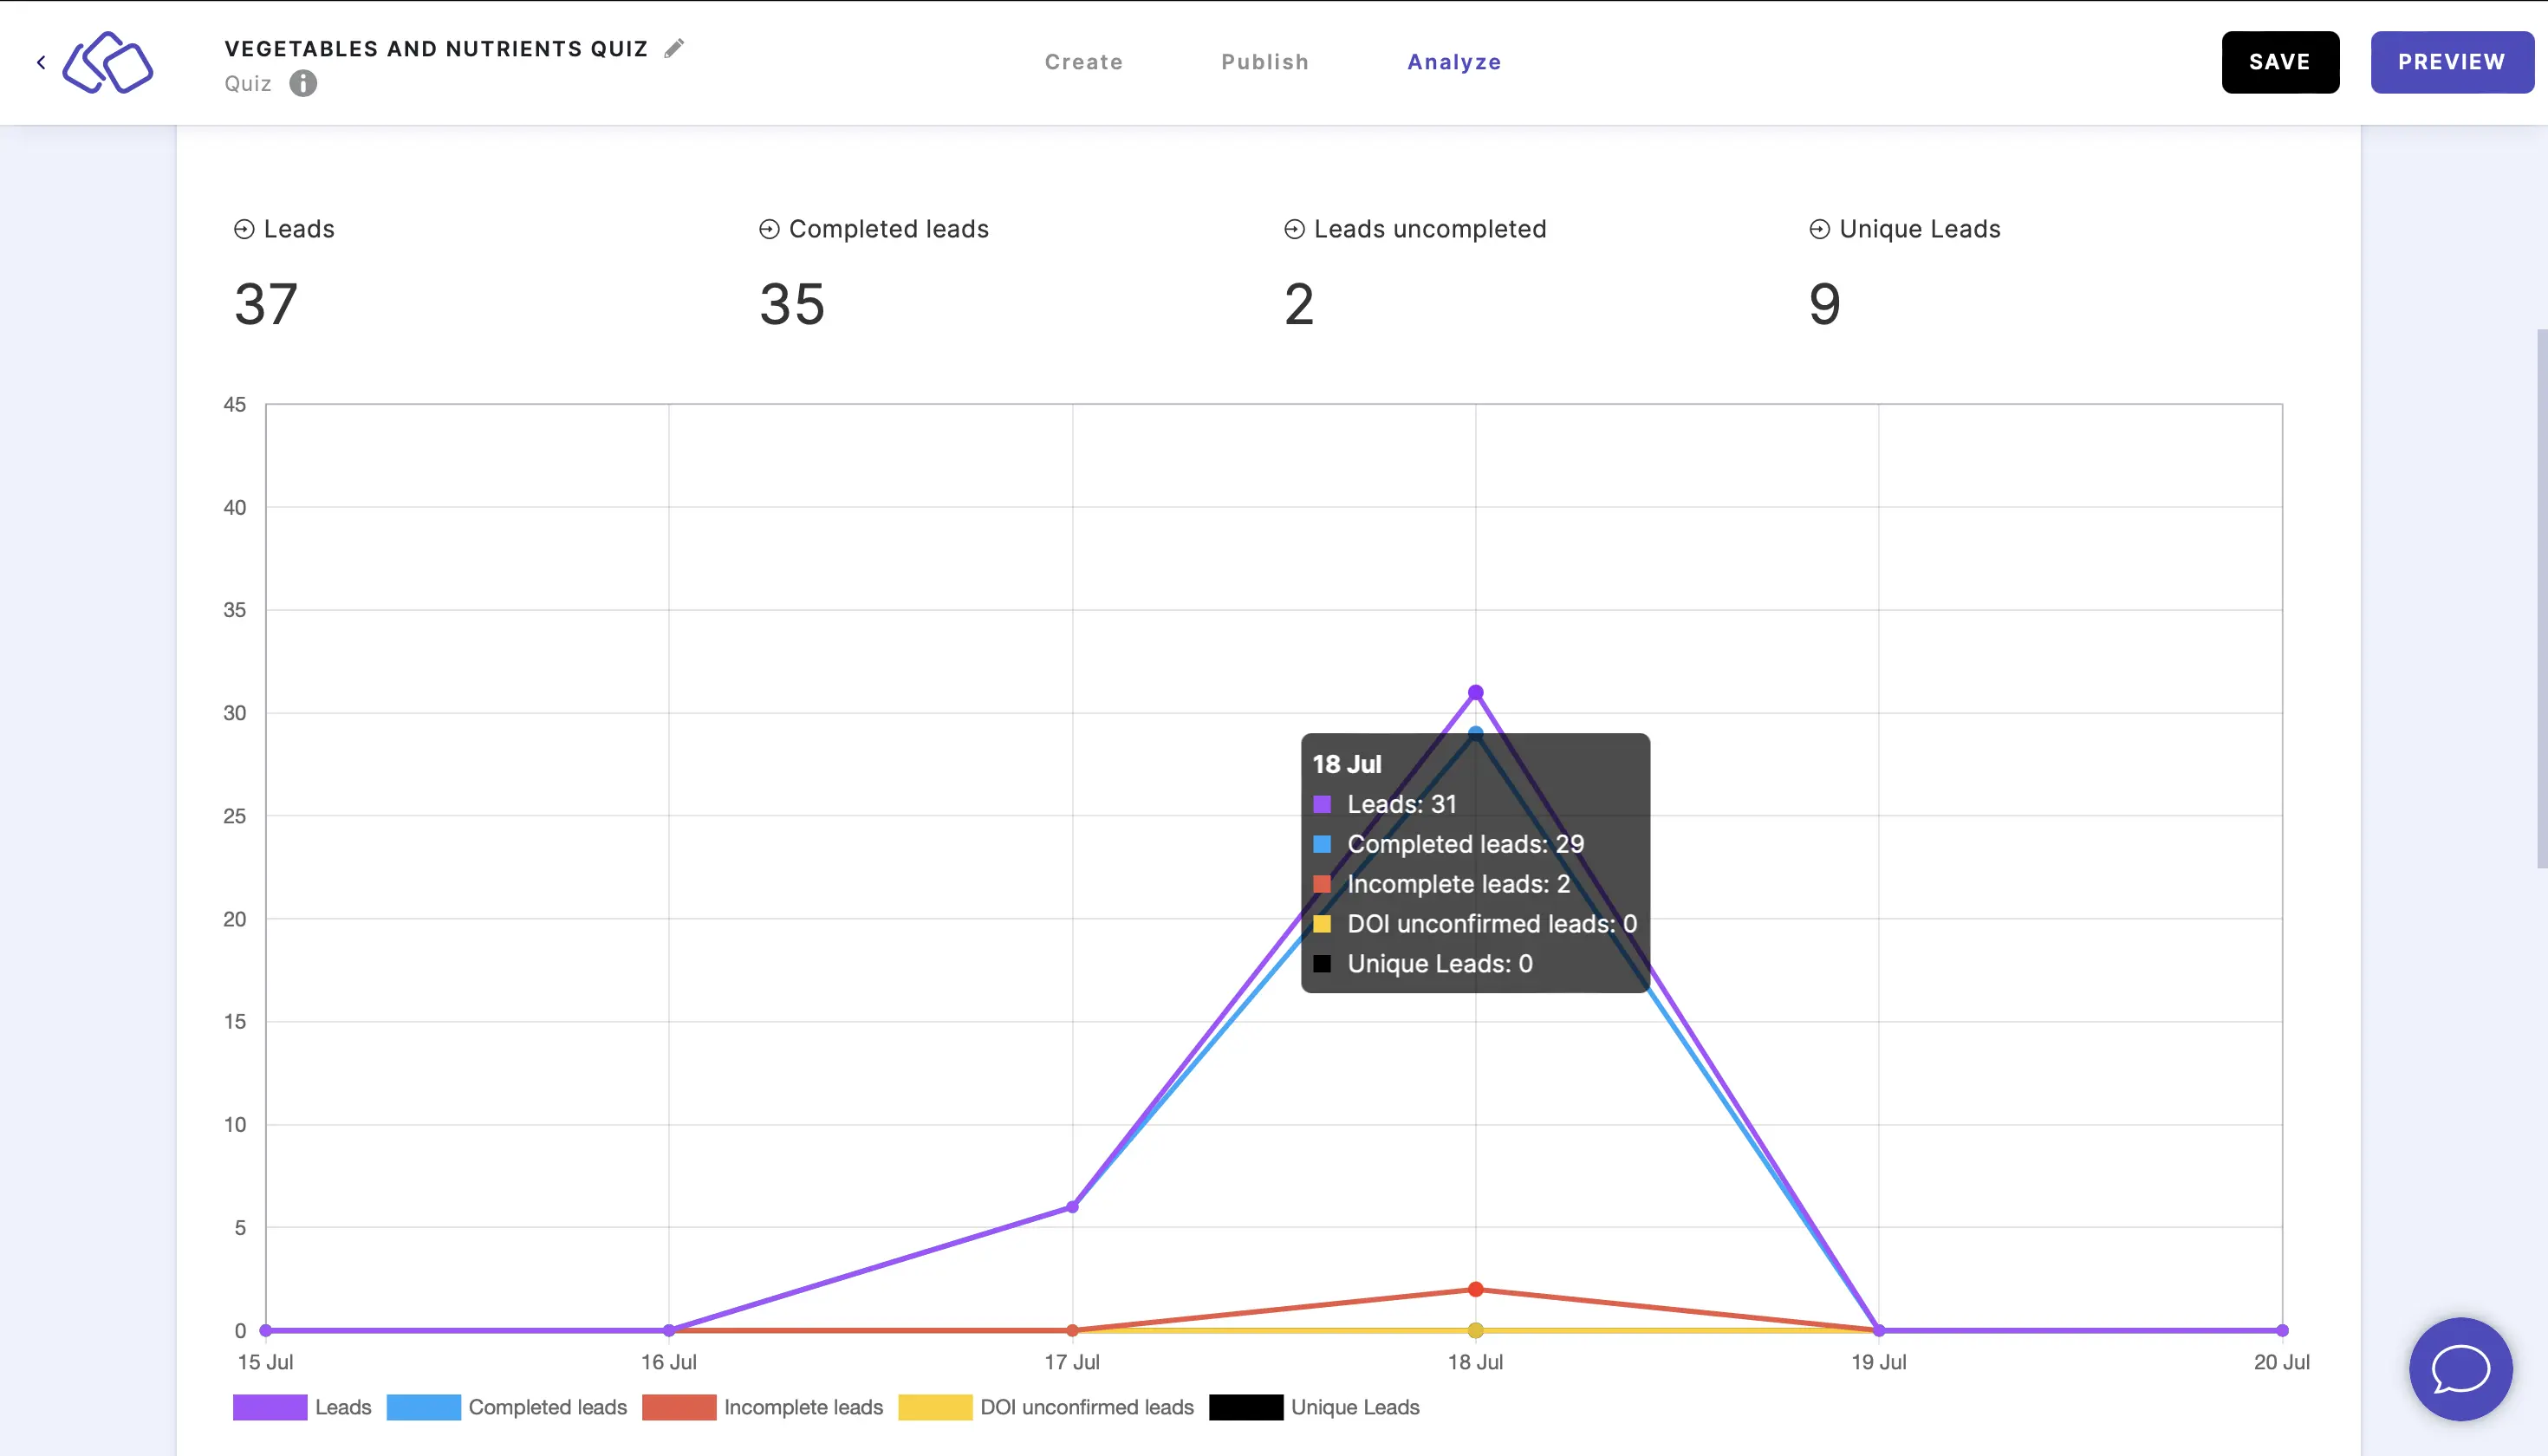
- Select or deselect any colored key at the bottom of the graph to isolate the data you need on the line graph.
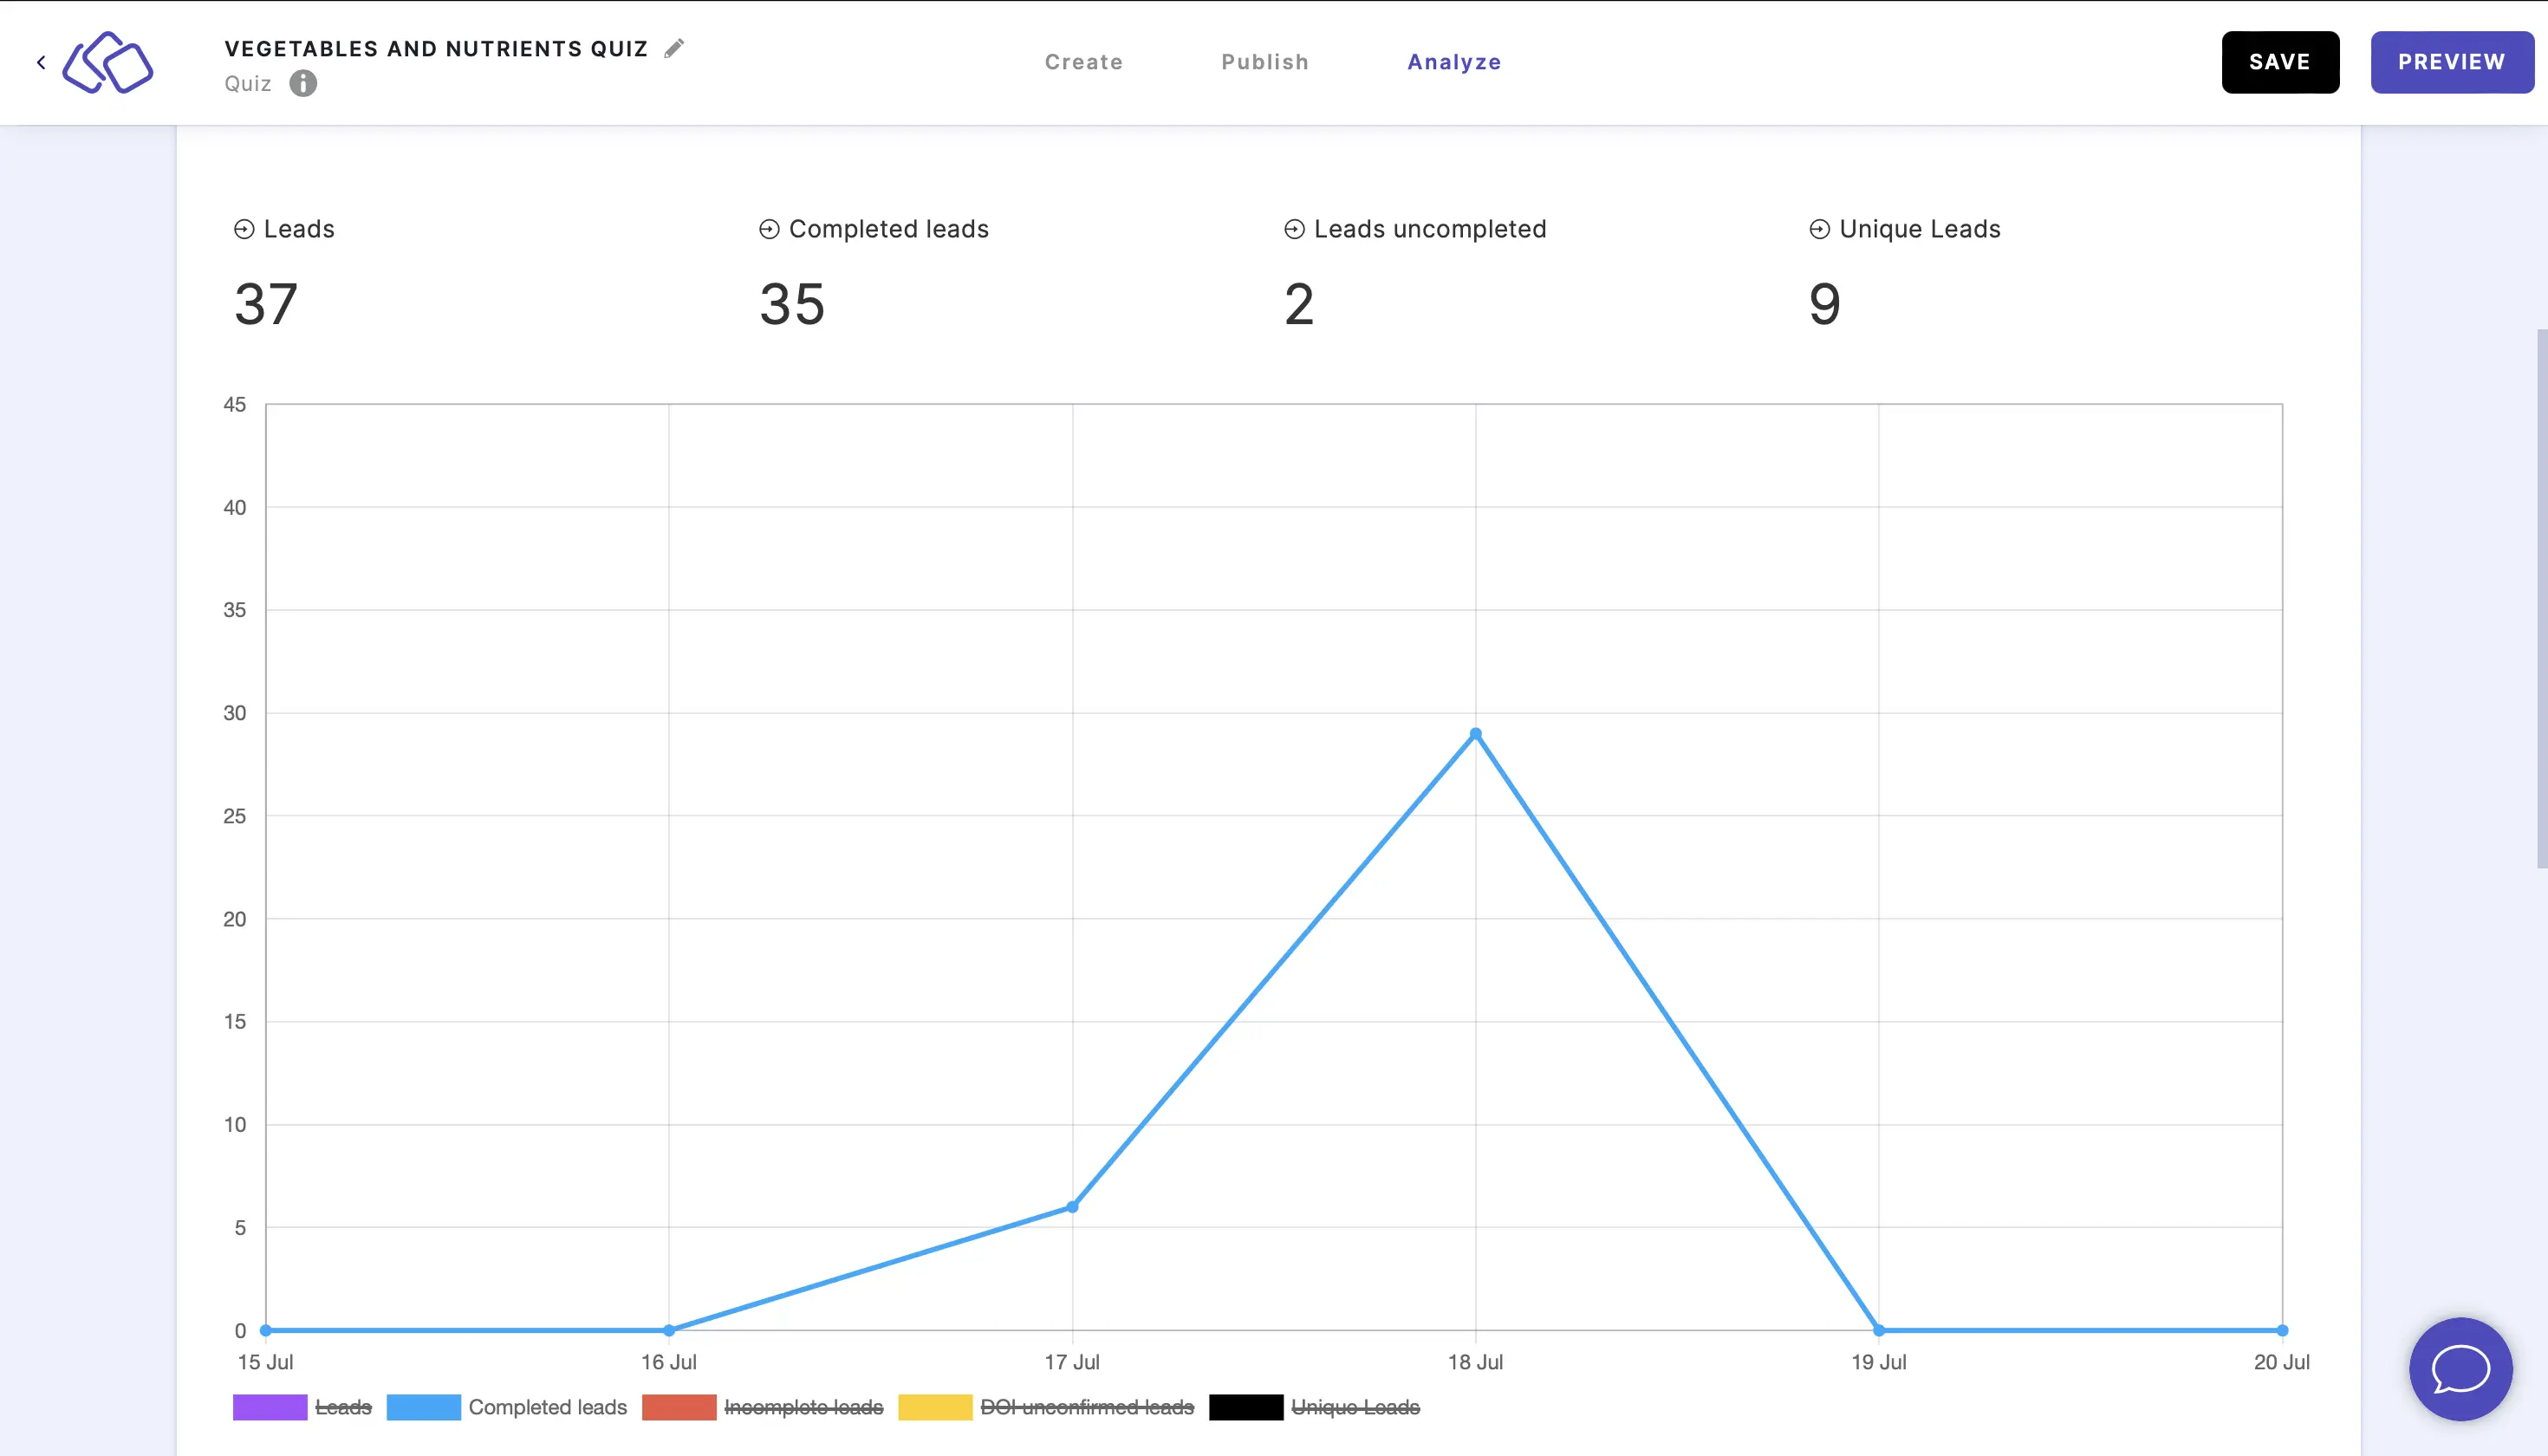
- Hover over any line to see the data summarized for any given date.
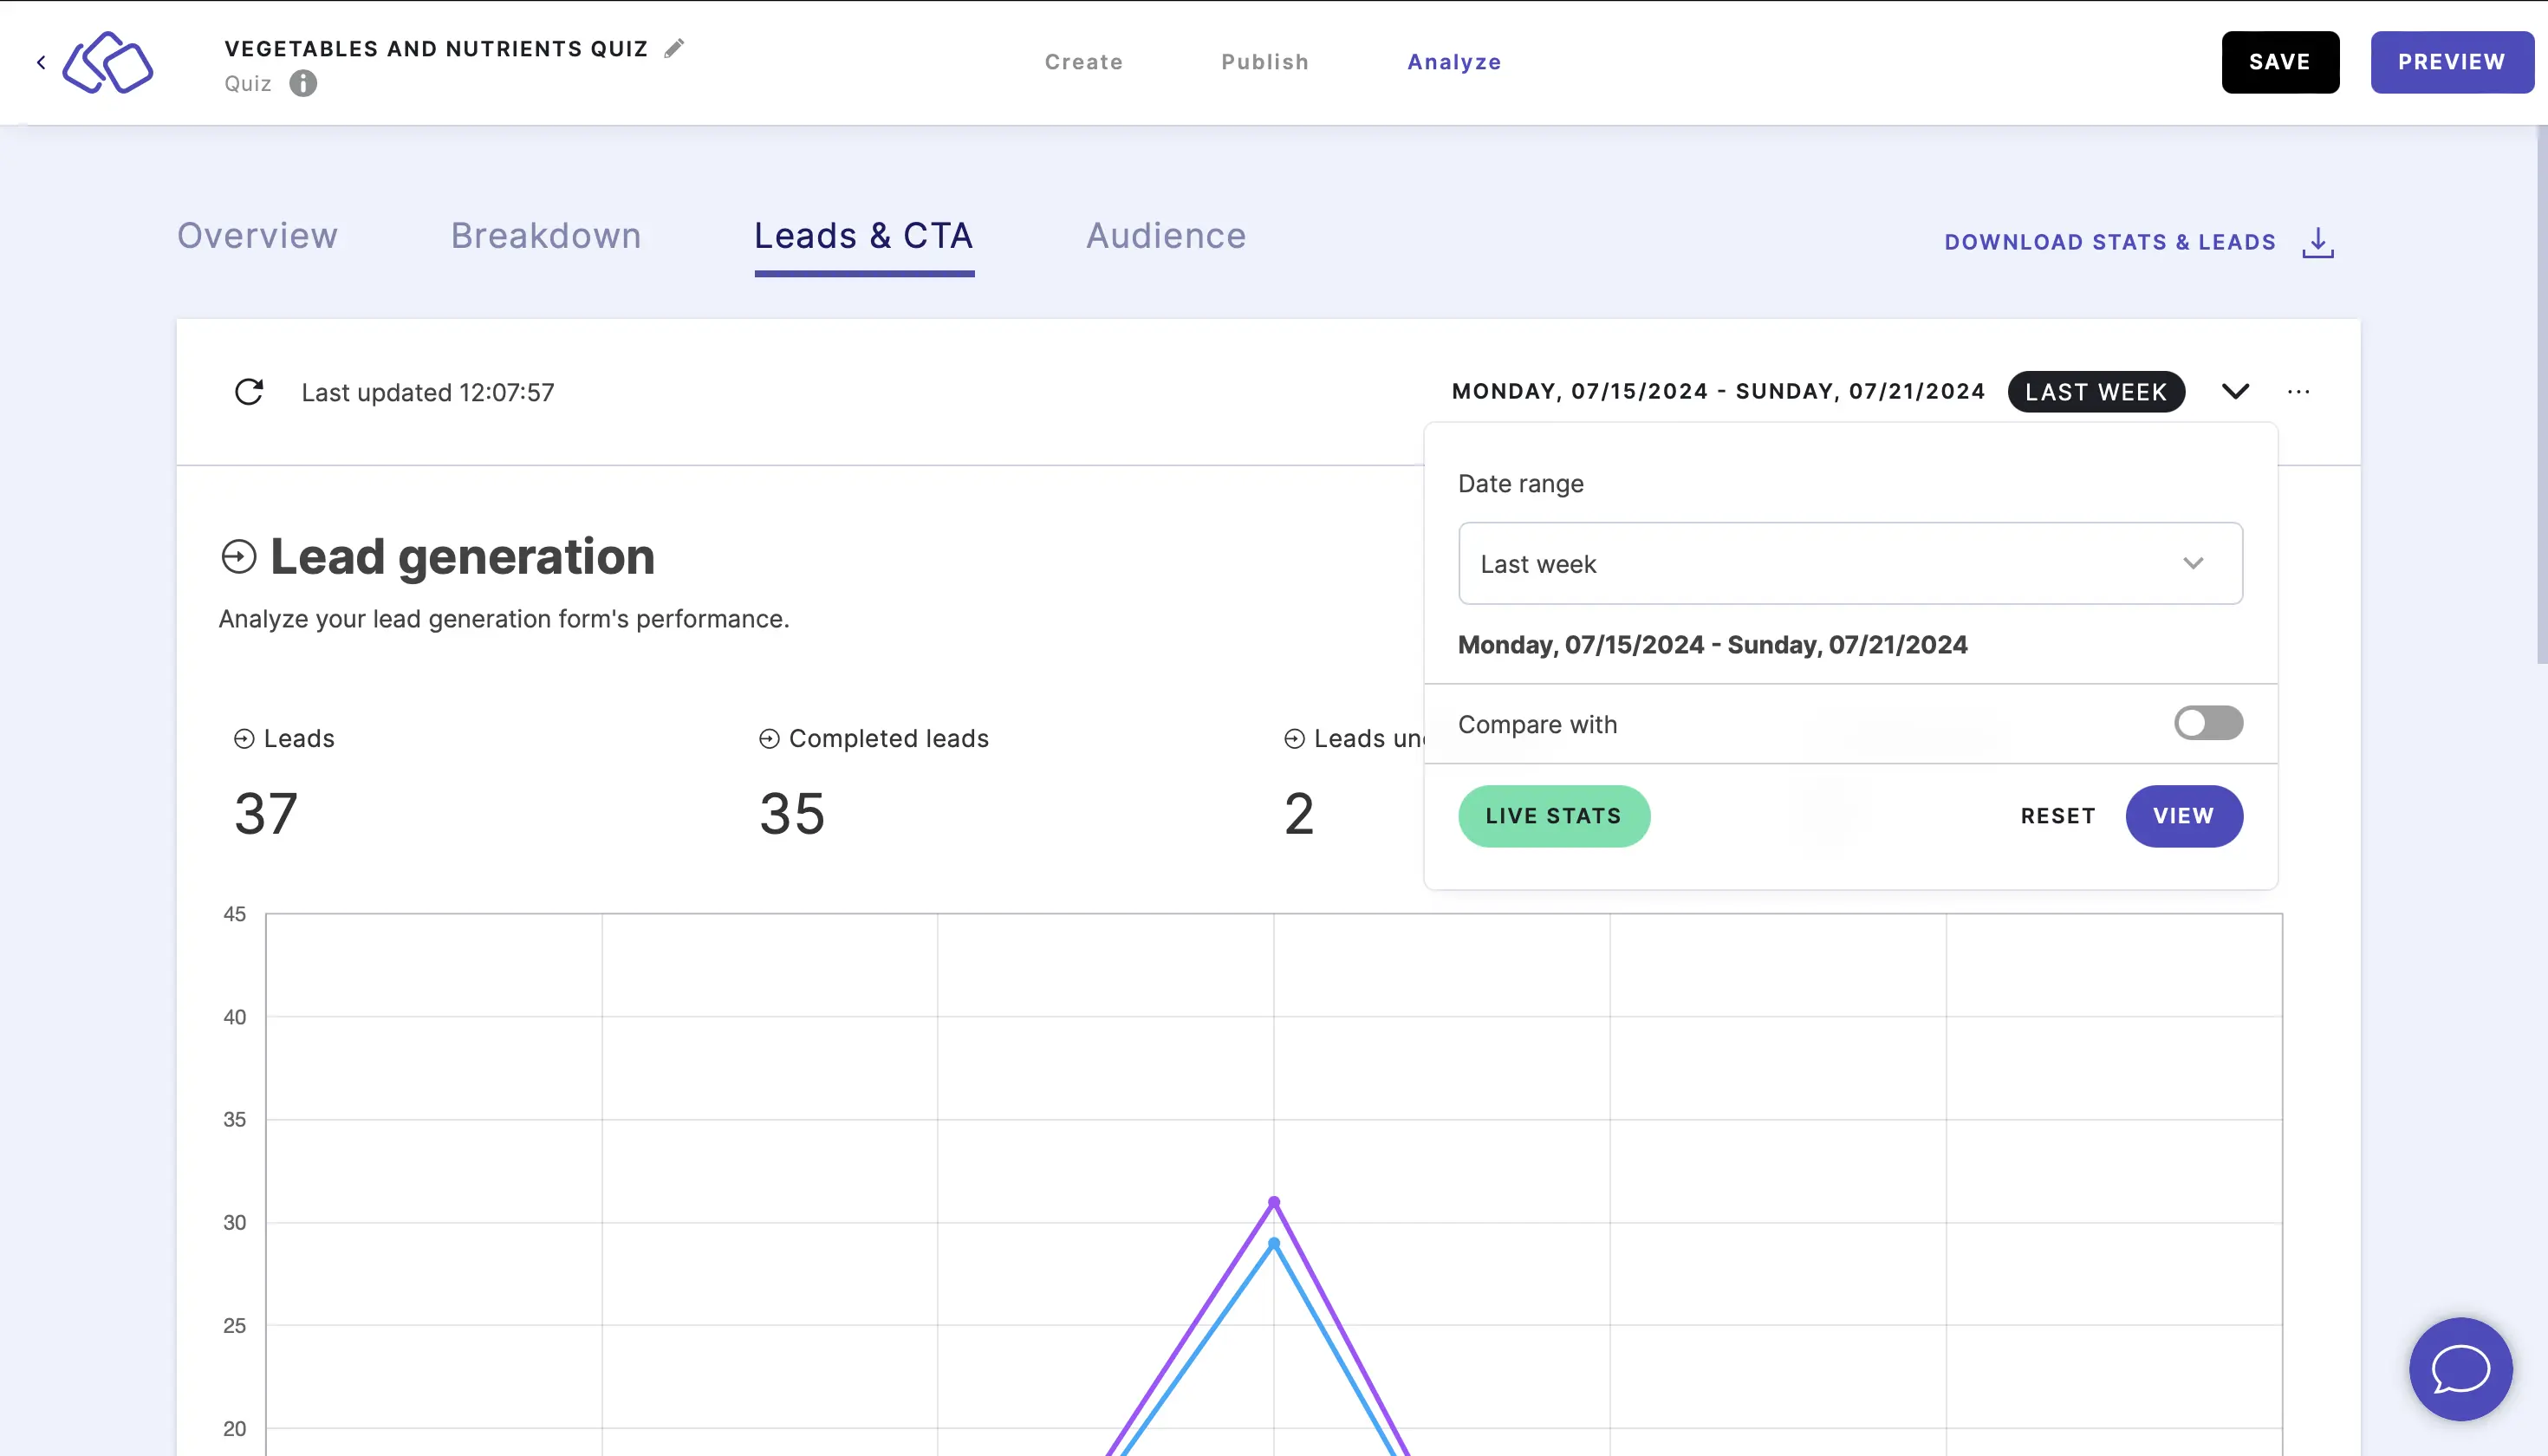
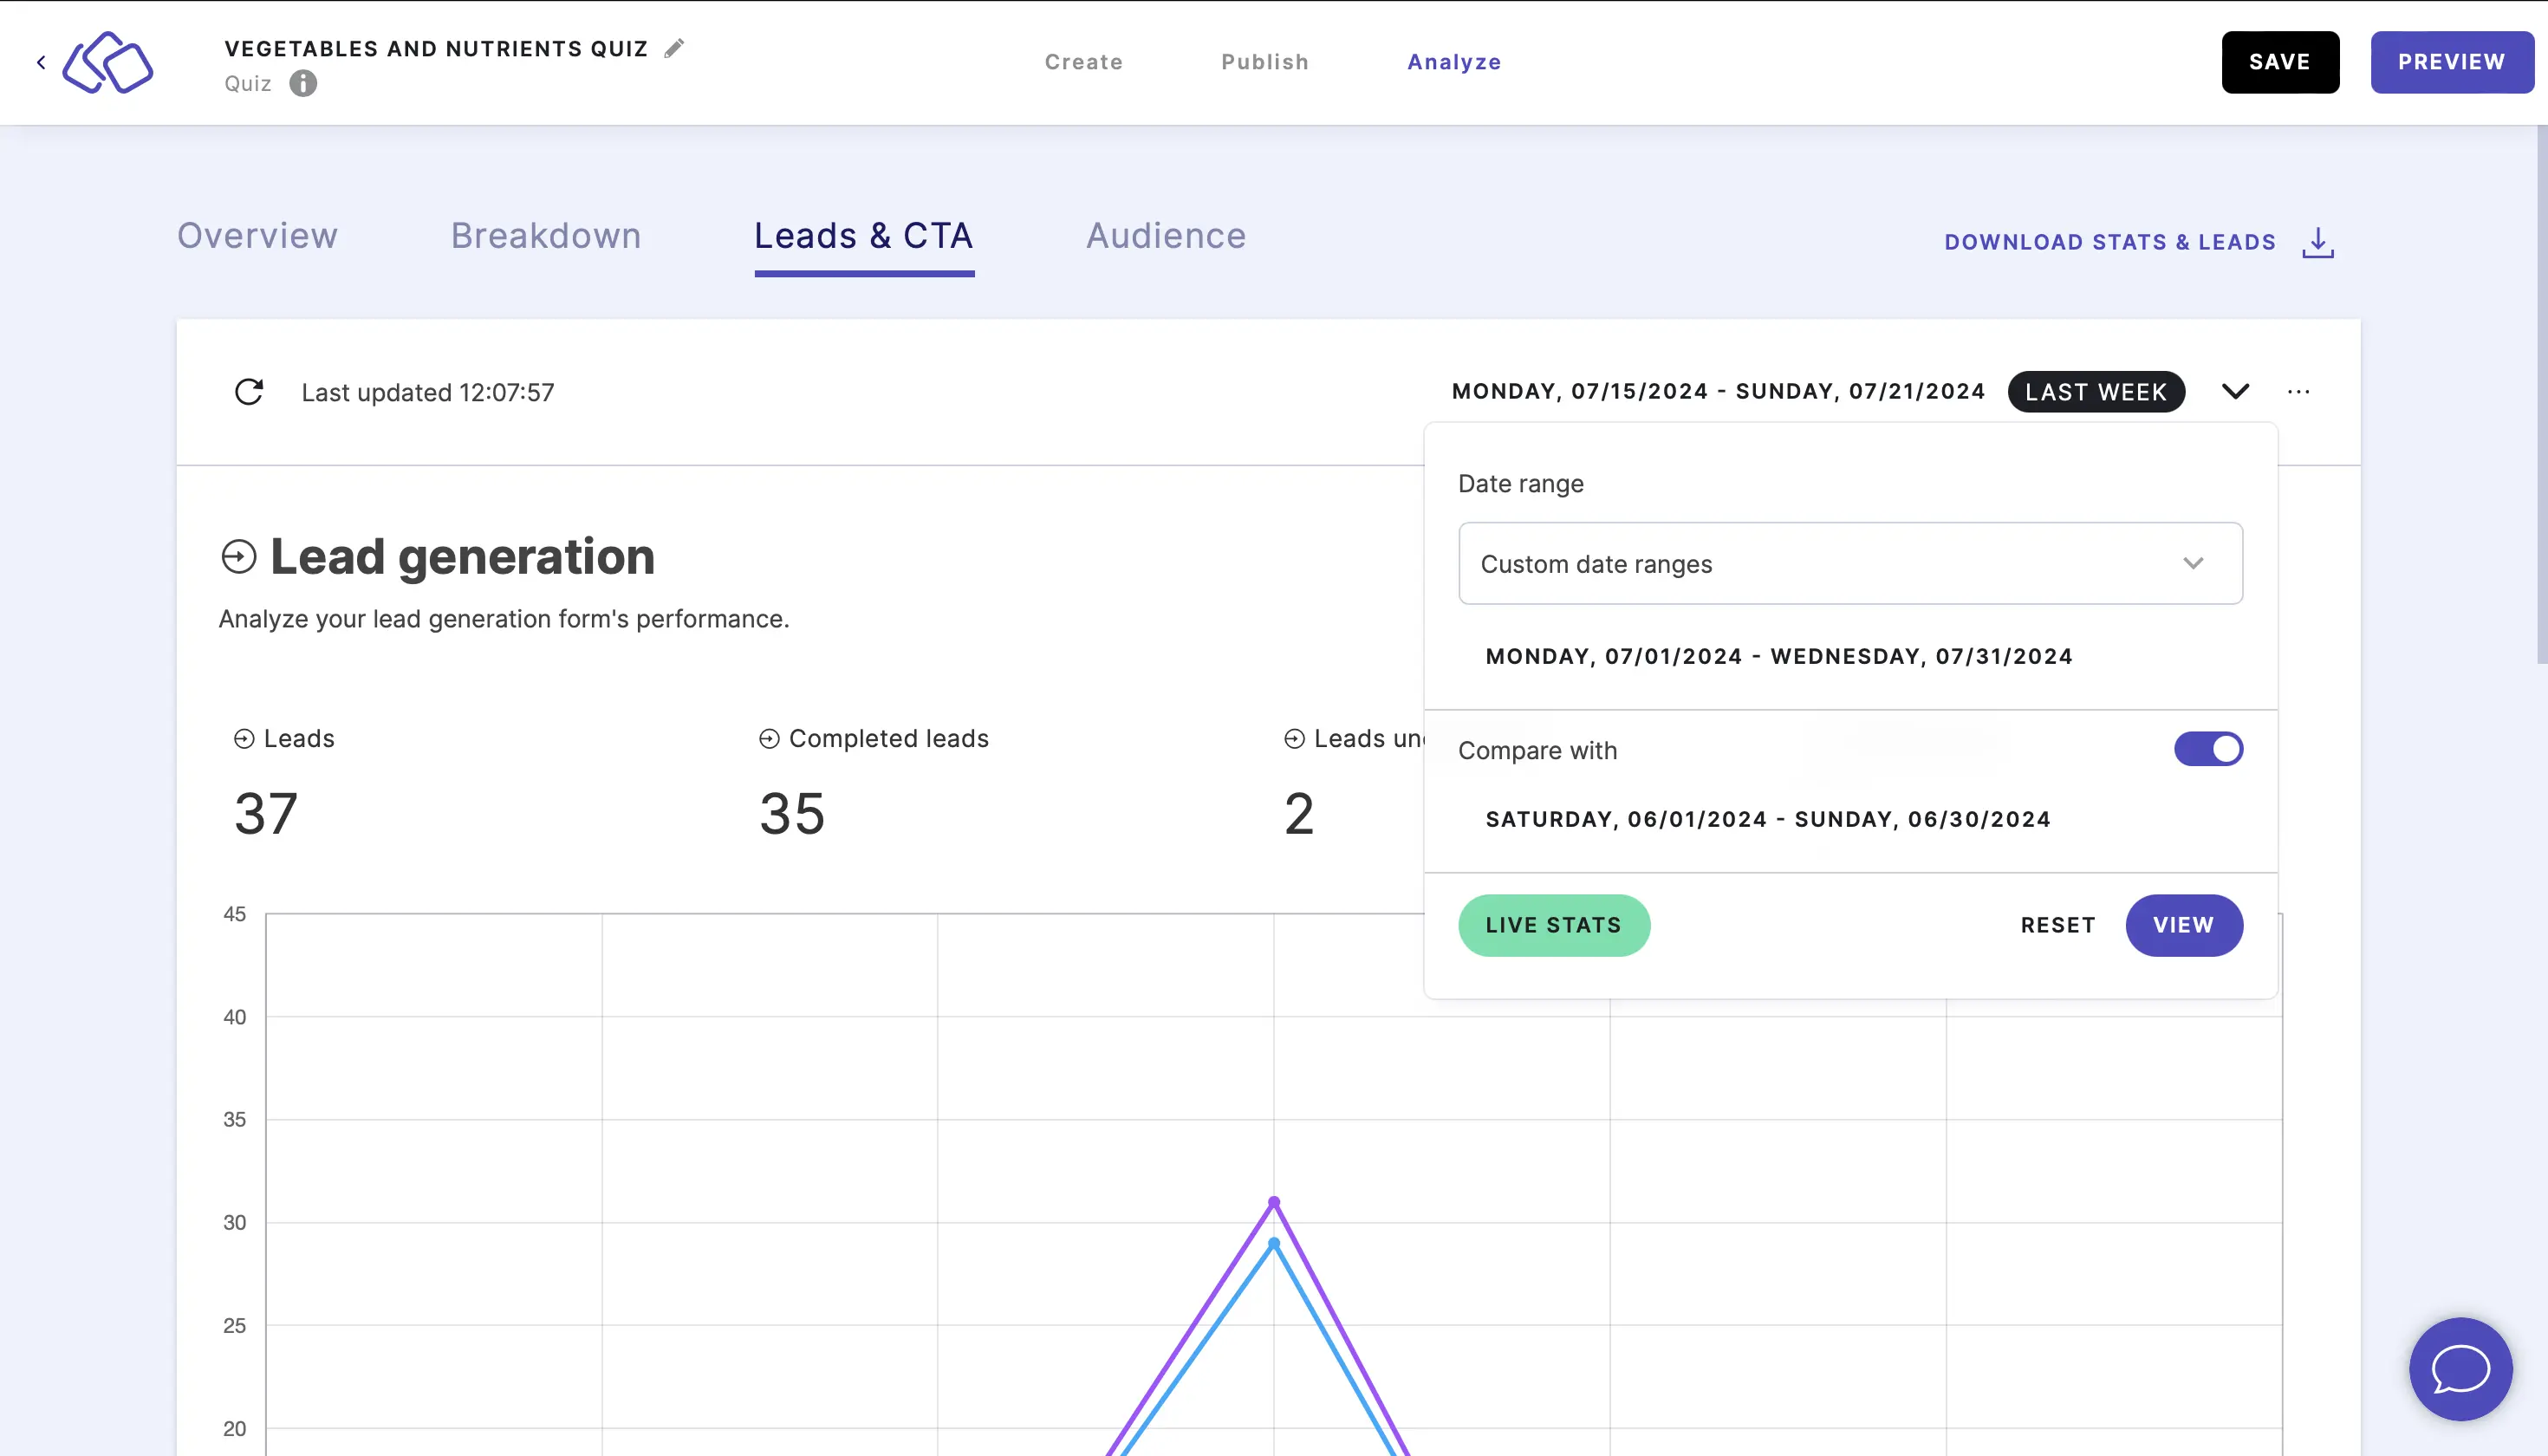
- The default view and time range is set to current week. To view live stats, click on the down arrow on the right and click on LIVE STATS. As soon as the Riddle is viewed or played, all associated statistics will appear on this dashboard here as they come in without refreshing the page.
- To filter the stats to a specific time frame, click on the down arrow on the right, select a date range, and click on VIEW.
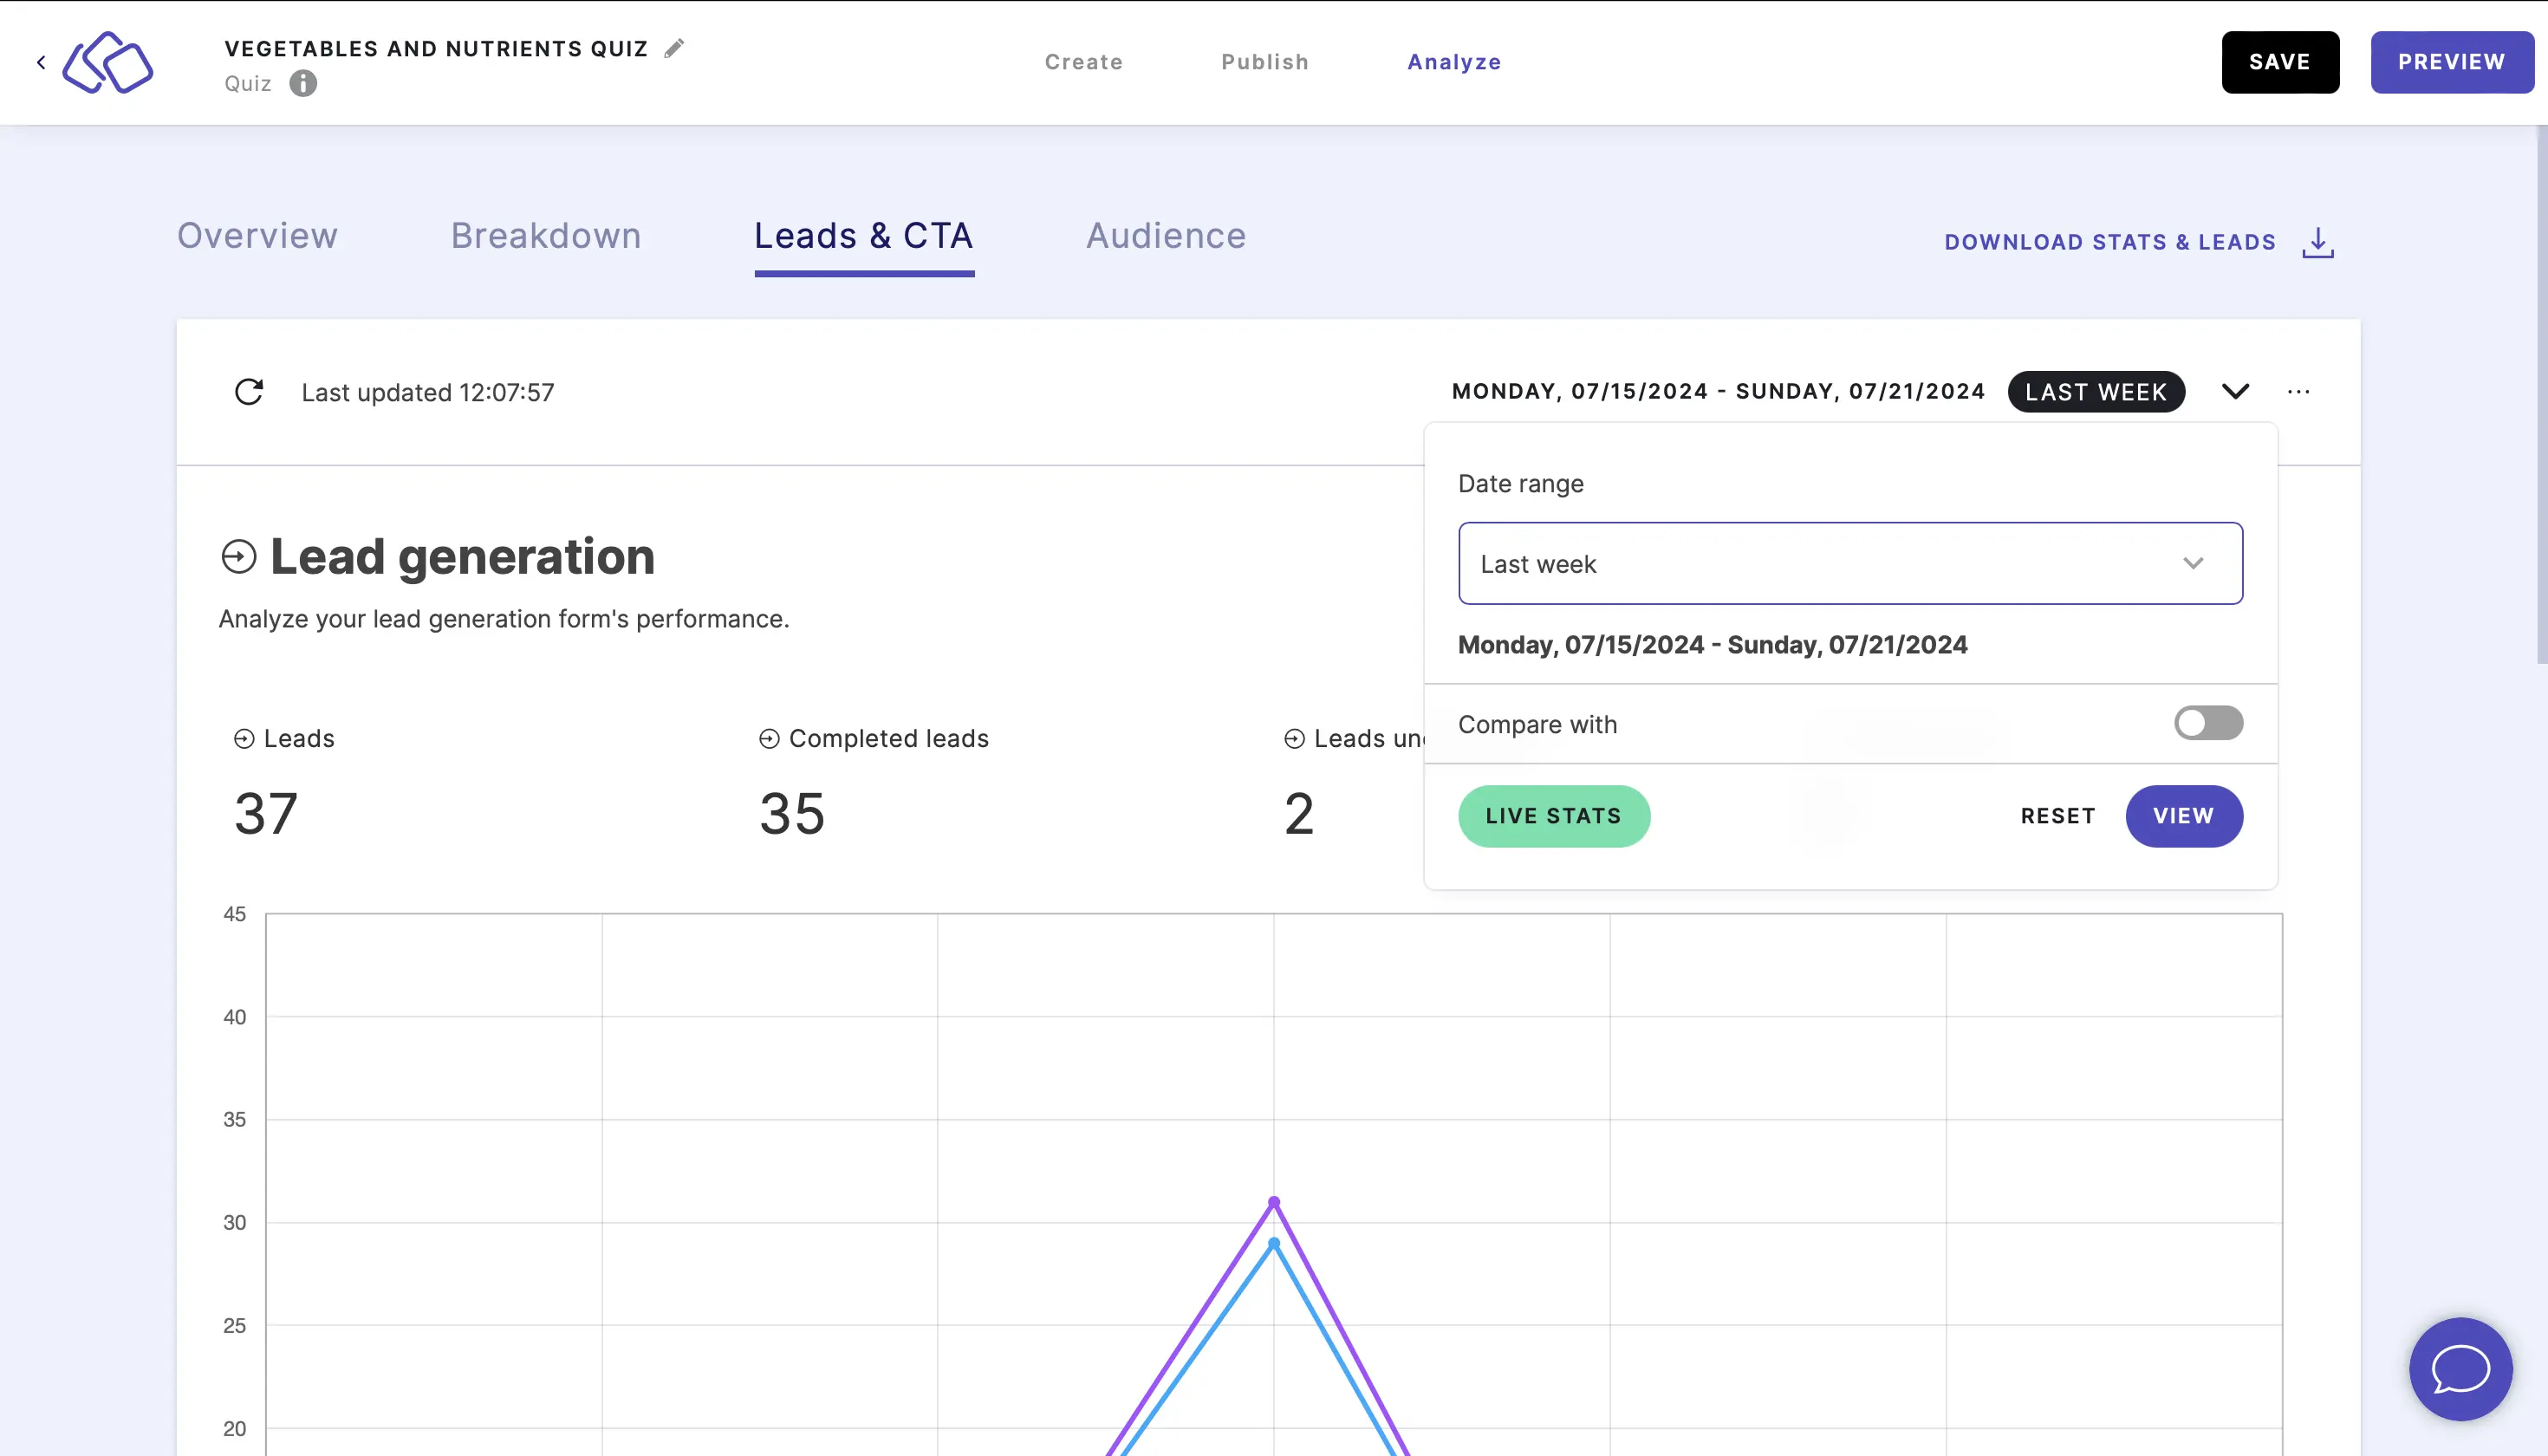
- To compare two custom time ranges, click on the down arrow on the right, select and input Custom date ranges, enable Compare with, and click on VIEW.
- To delete stats, click on the three dots on the right, click on RESET STATS, and in the pop-up that appears select the checkbox and click on OK.
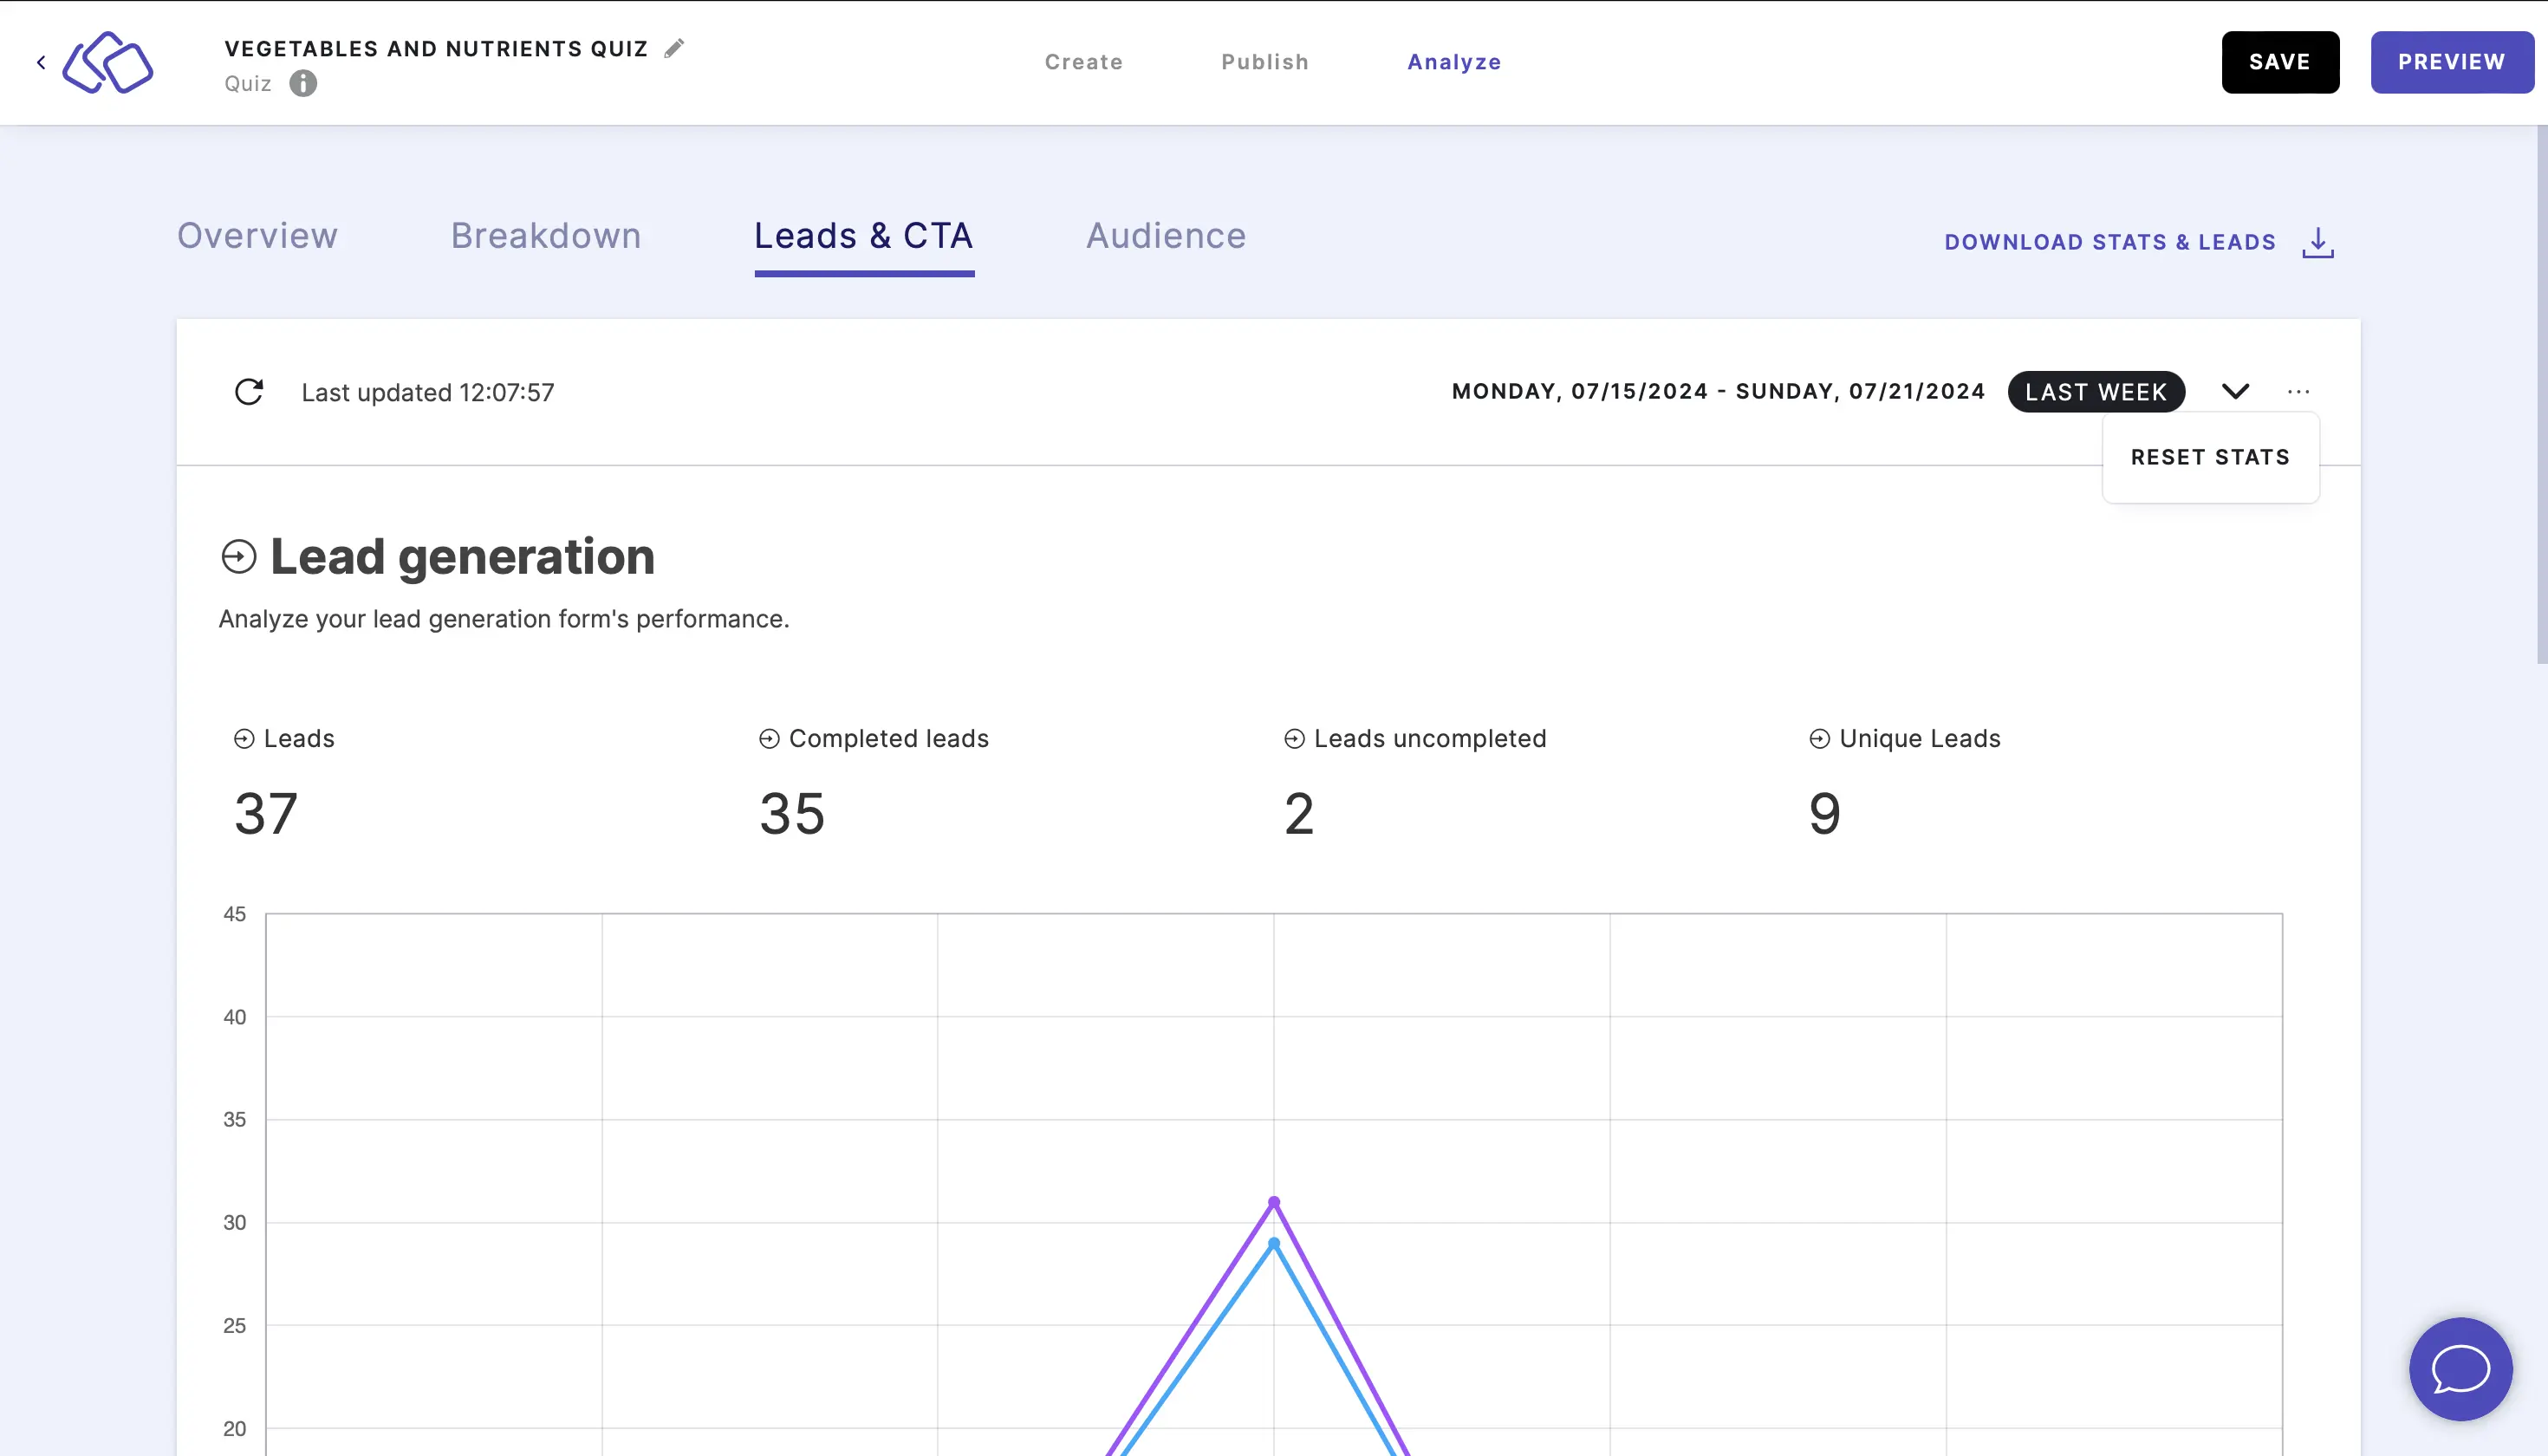
Caution: This will delete all stats for this Riddle.
Understand lead generation
Lead generation is your leads stats and a visual represenation of those figures.
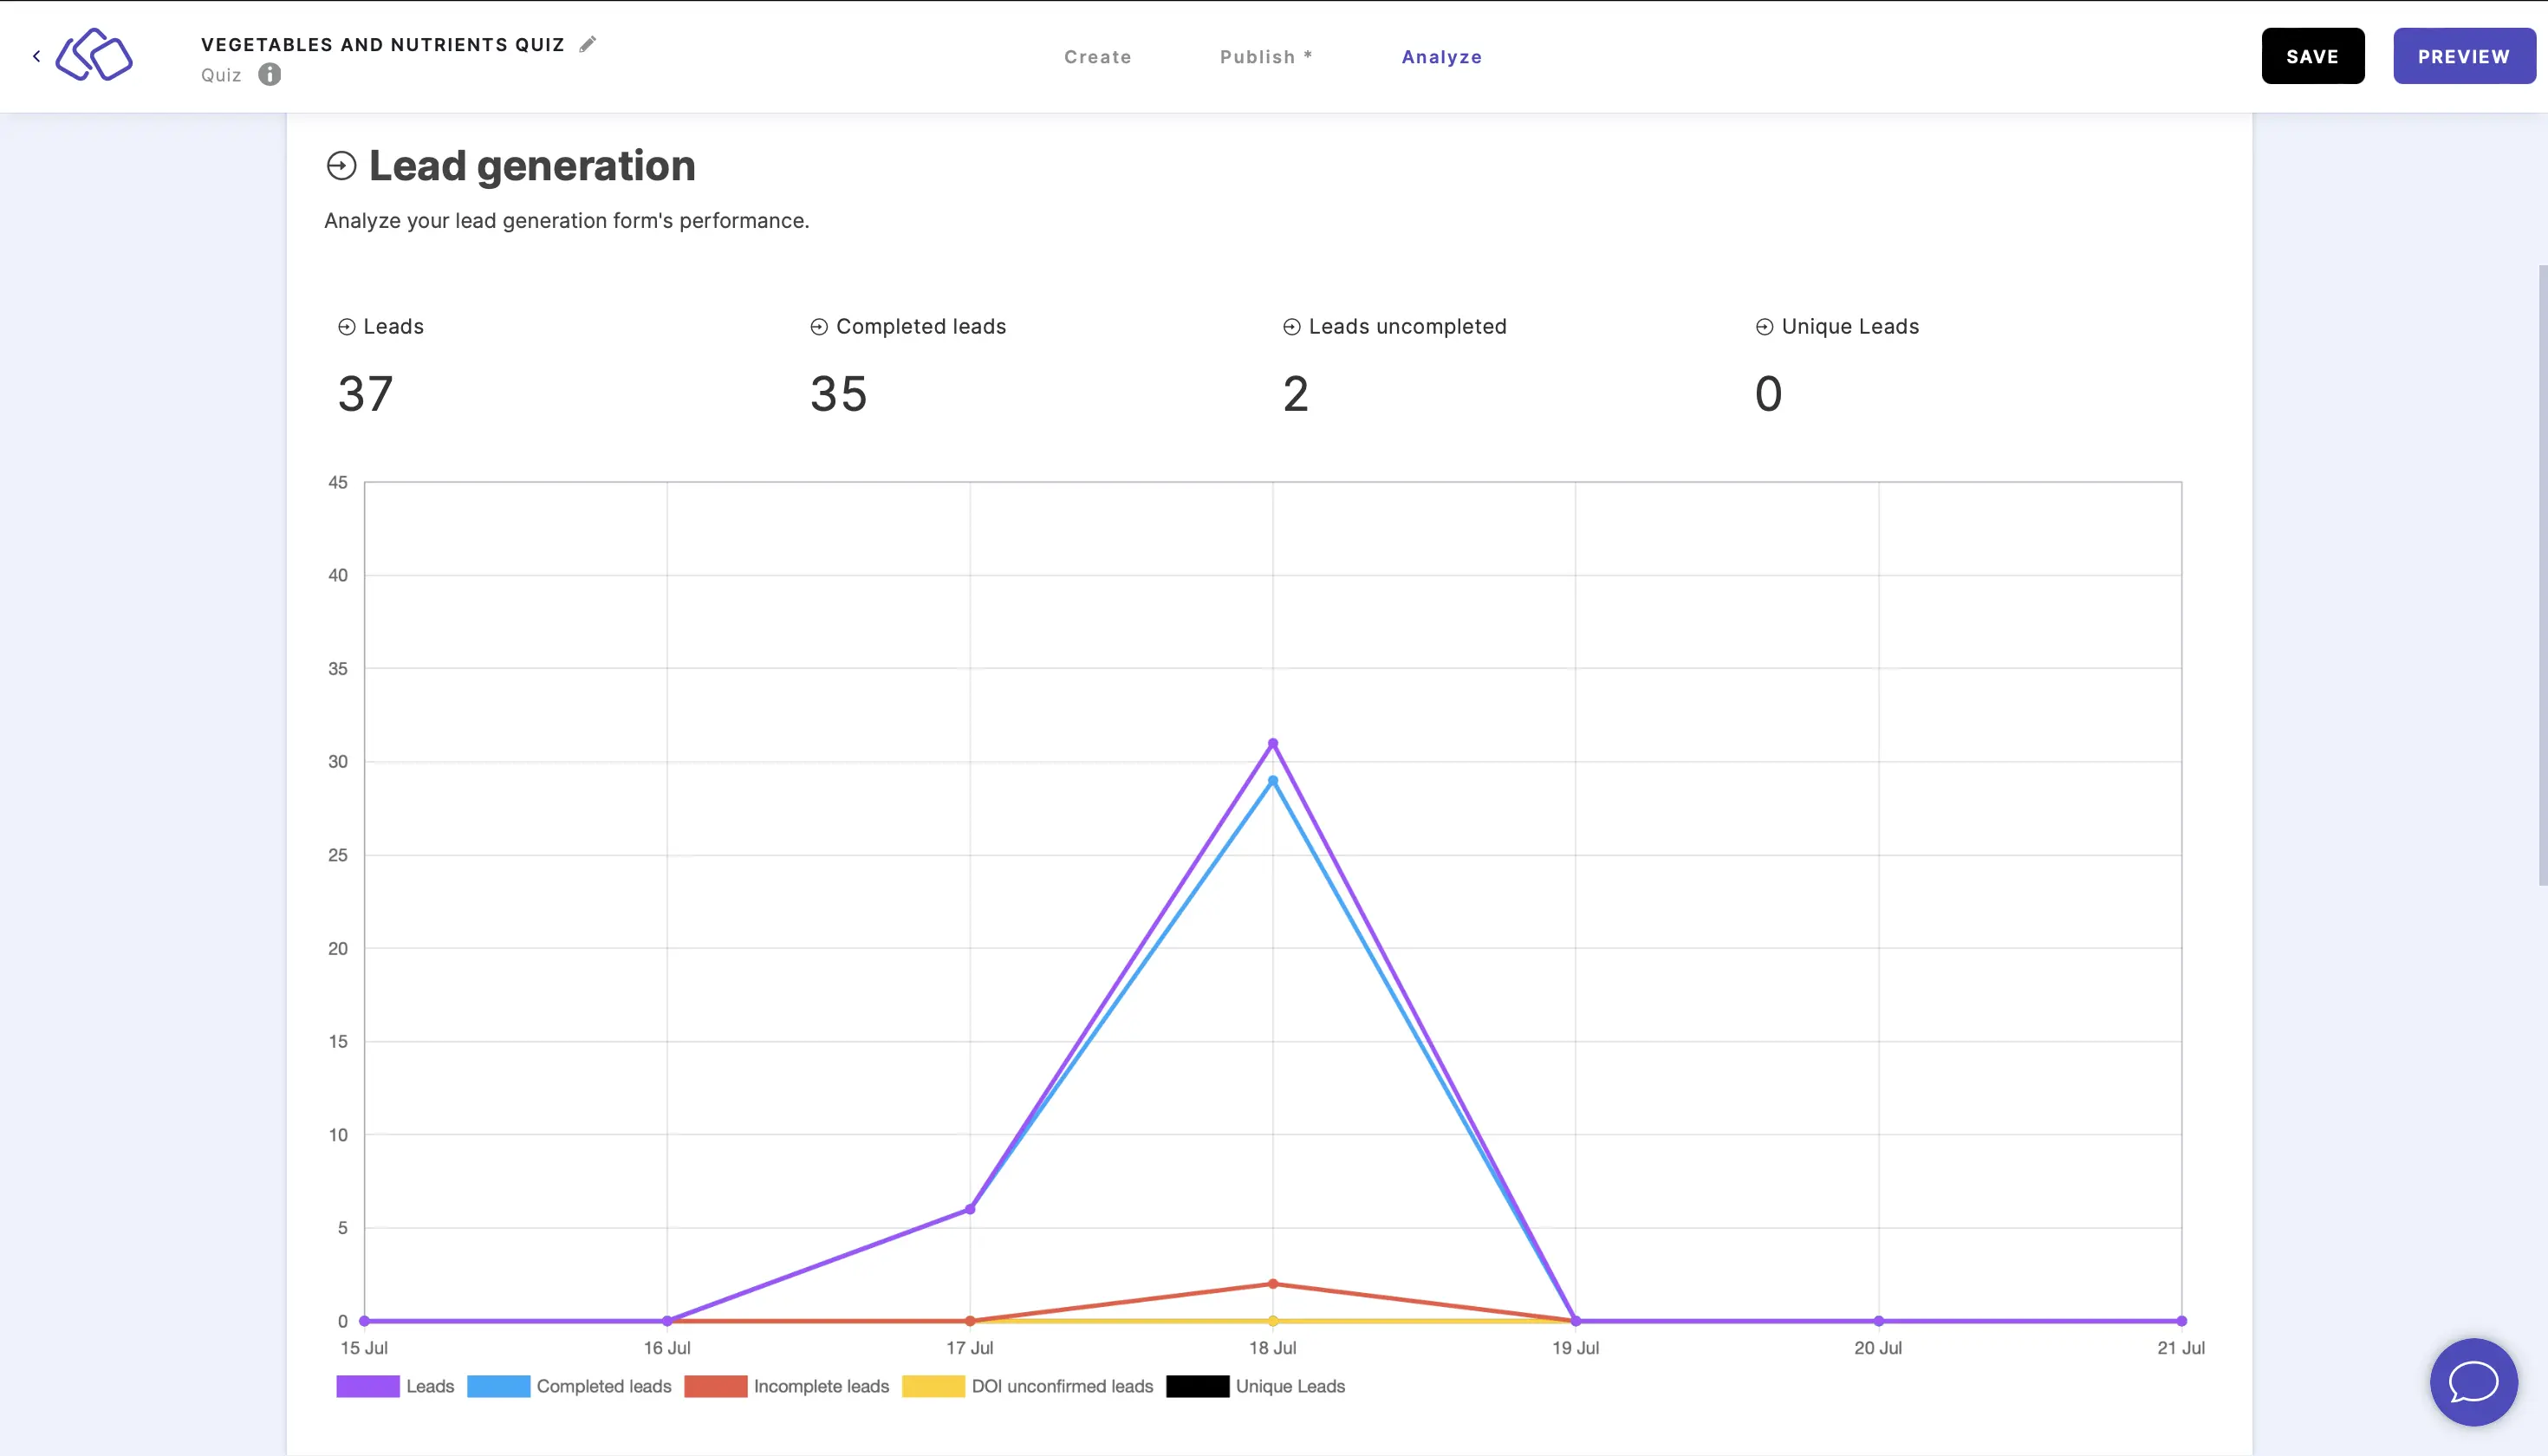
There are five different statistics:
- Leads* - leads where one form field is filled out OR other option/freetext is filled out OR data layer is filled out.
- Completed leads* - the total number of leads that submitted every required form field and lead identifier was filled (if set).
- Incomplete leads* - the total number of leads minus completed leads.
- DOI unconfirmed leads - the total number of users that completed the Riddle but did not confirm DOI via the DOI email.
- Unique leads - the total number of leads minus duplicates
*The definition of lead was changed on the 17th October 2024, upon popular request from our users. The definitions until 16th October 2024 were the following:
- Leads - the total number of tracked entries in form blocks.
- Completed leads - the total number of users that finished a Riddle.
- Incomplete leads - the total number of users that finished the first block of your Riddle.
Understand form breakdown
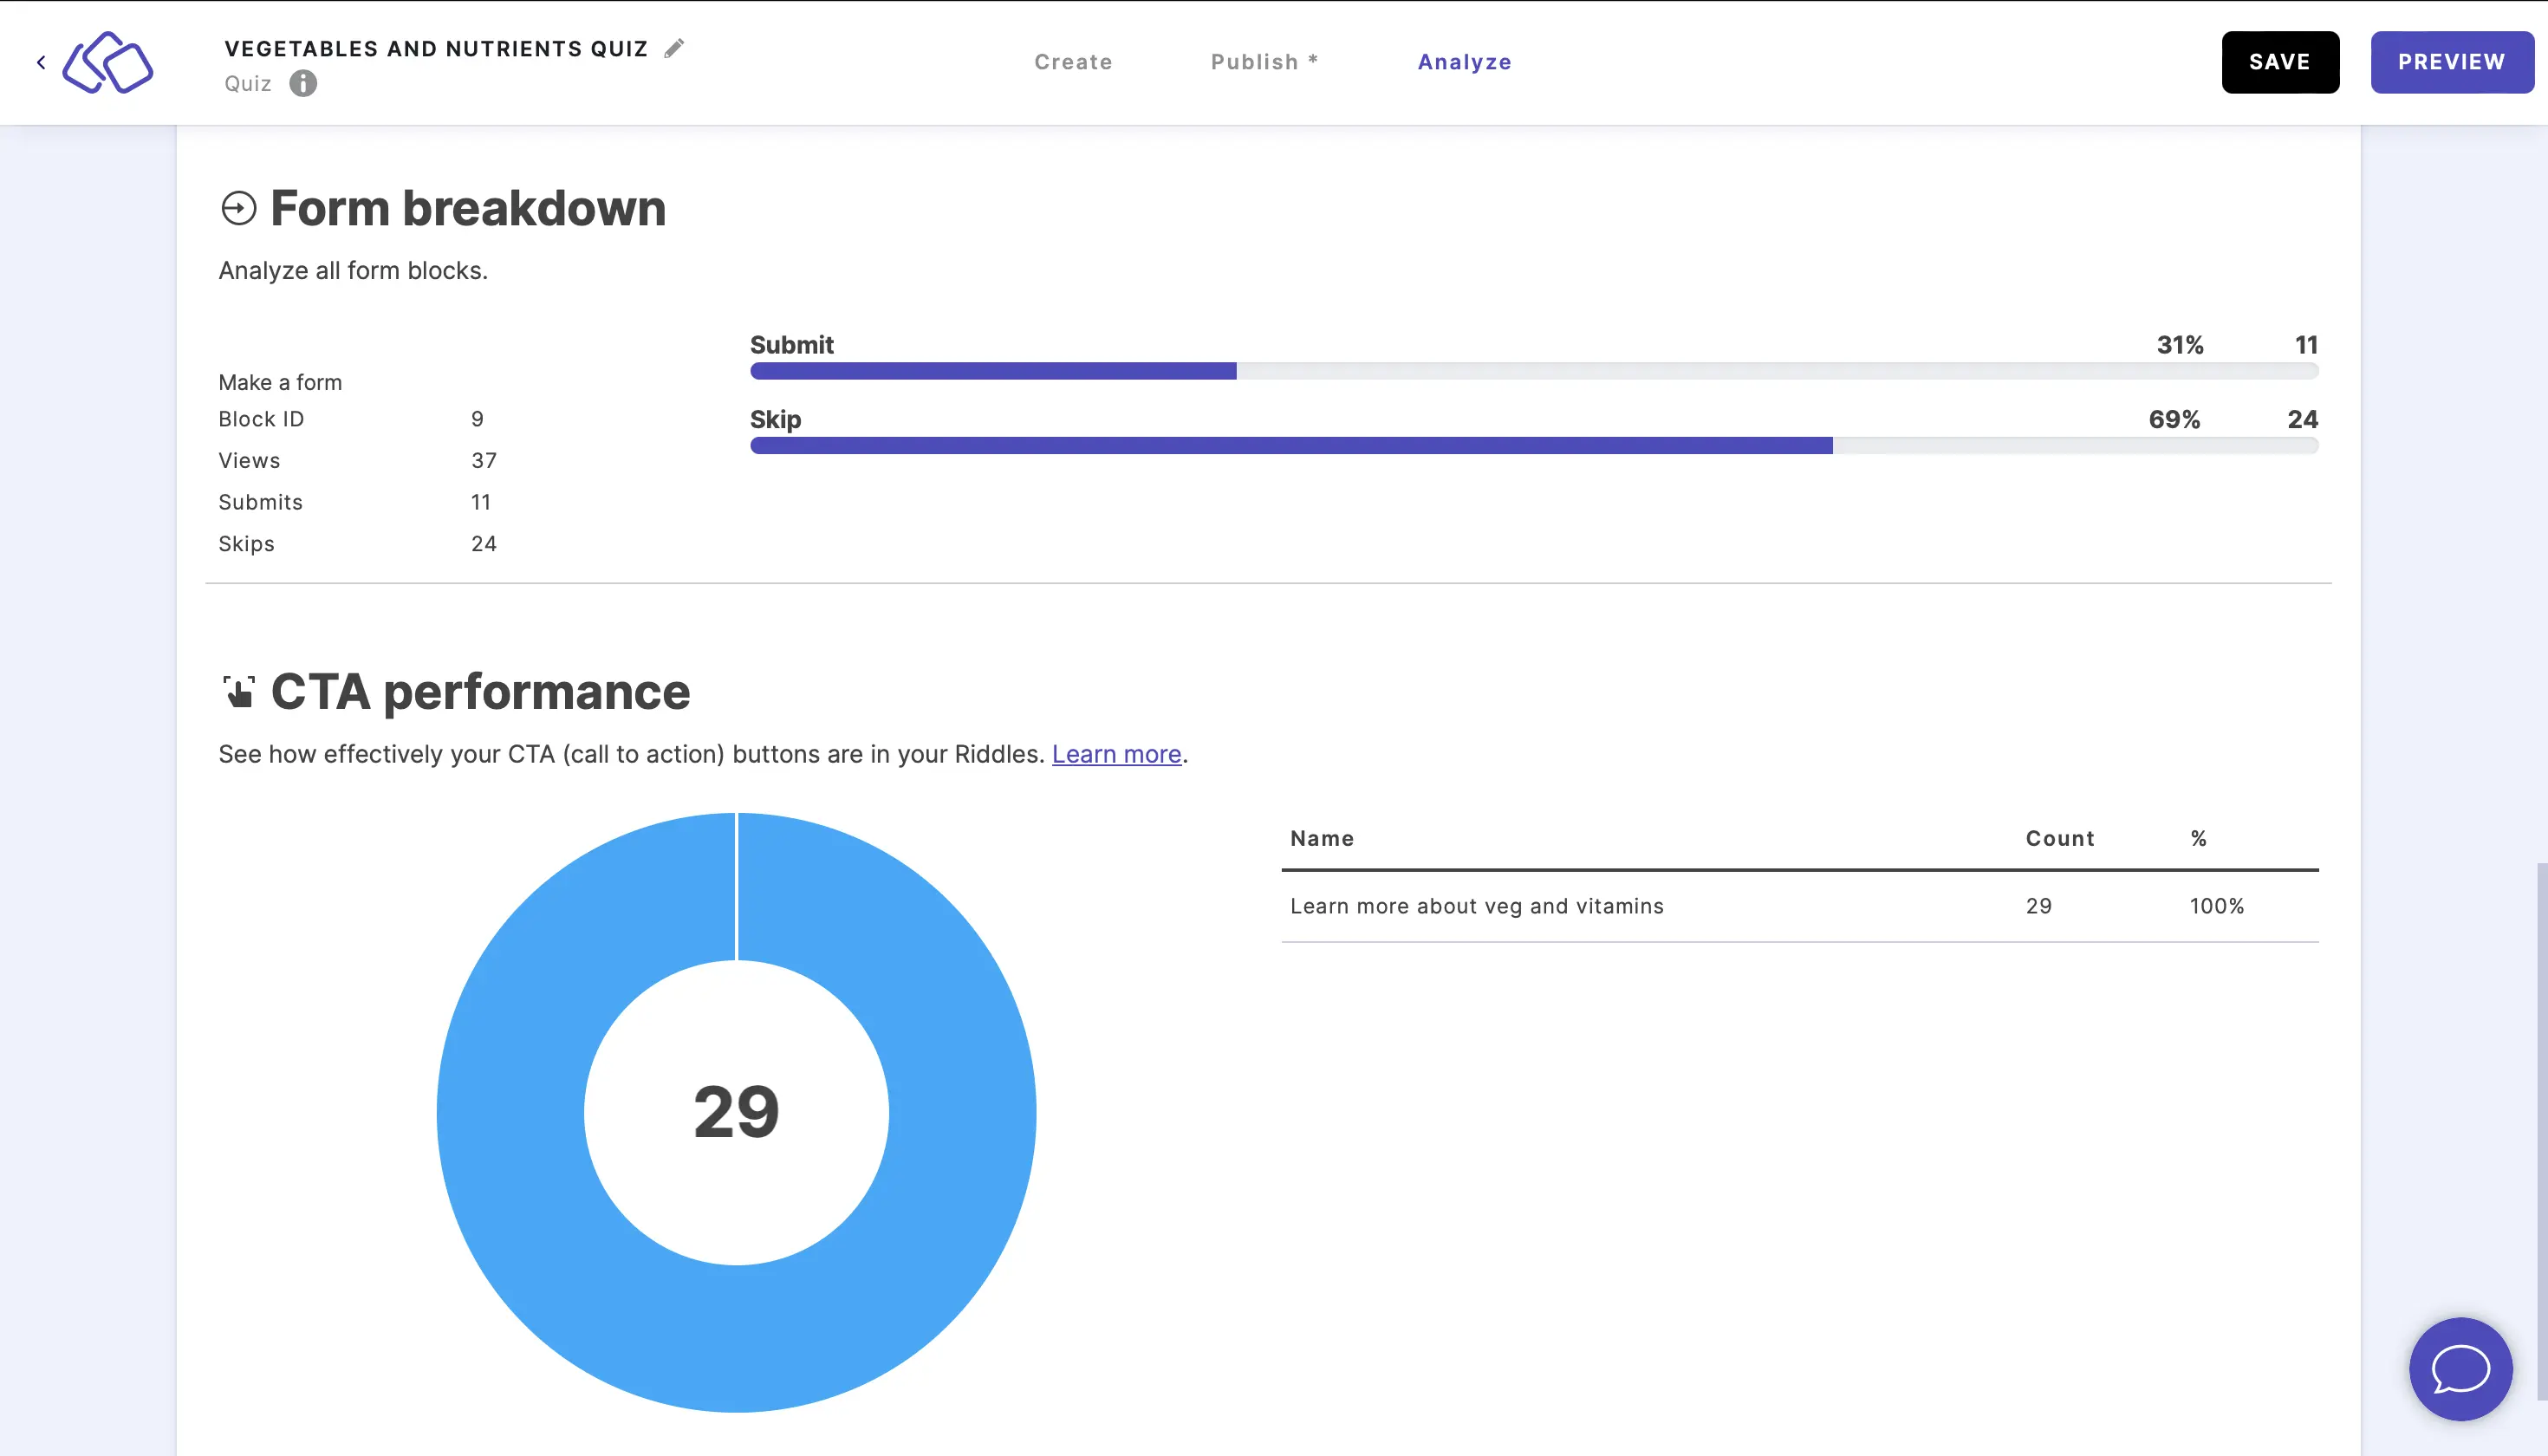
Form breakdown is a set of stats for each form (lead) block in your Riddle.
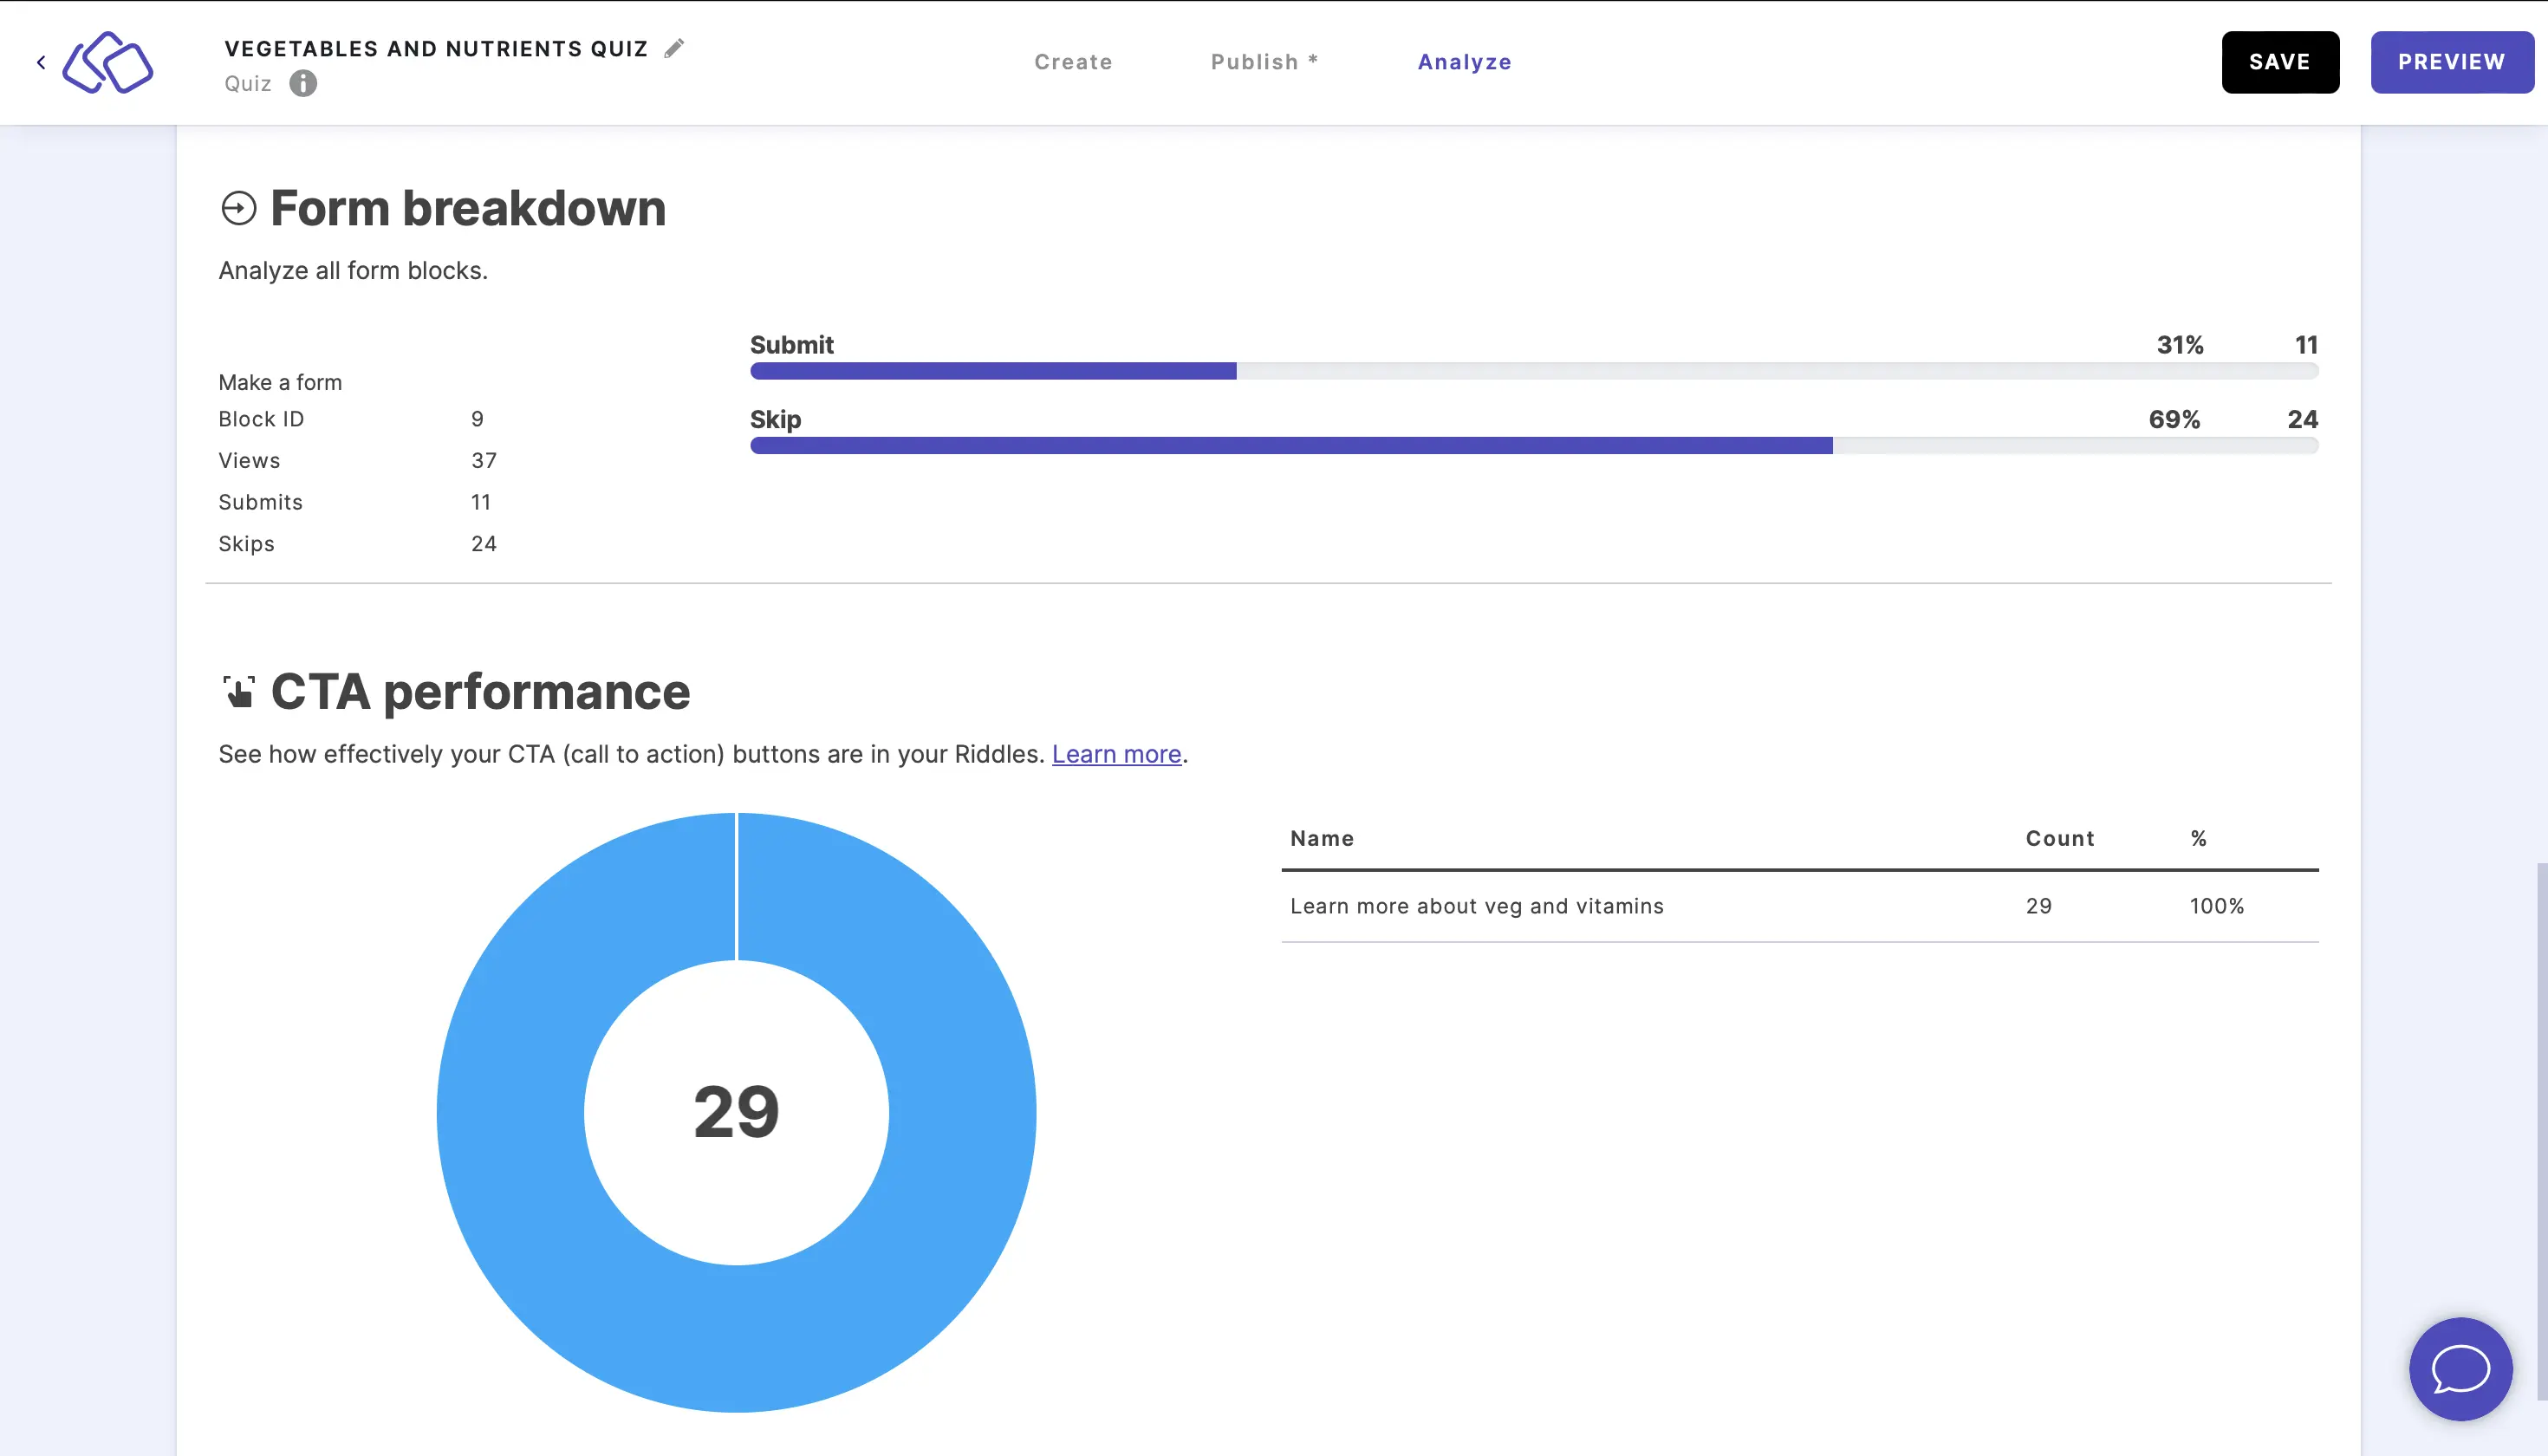
There are five statistics for each form block:
- Form block type
- Block ID - the number assigned to that block
- Views - the number of times the block was opened
- Submits - the number of times someone clicked on the 'Submit' (or your customized equivalent) button.
- Skips - the number of times someone clicked on the 'Skip' button
Submits and Skips are also displayed as a horizontal bar chart with the percentages and raw numbers of your audience.
Understand CTA performance
CTA (Call to action) performance is the number of times a CTA button on the result page was clicked and what percentage of all the CTA clicks this represents. If you only have one CTA button in your Riddle, the percentage will therefore be 100%.
Download leads
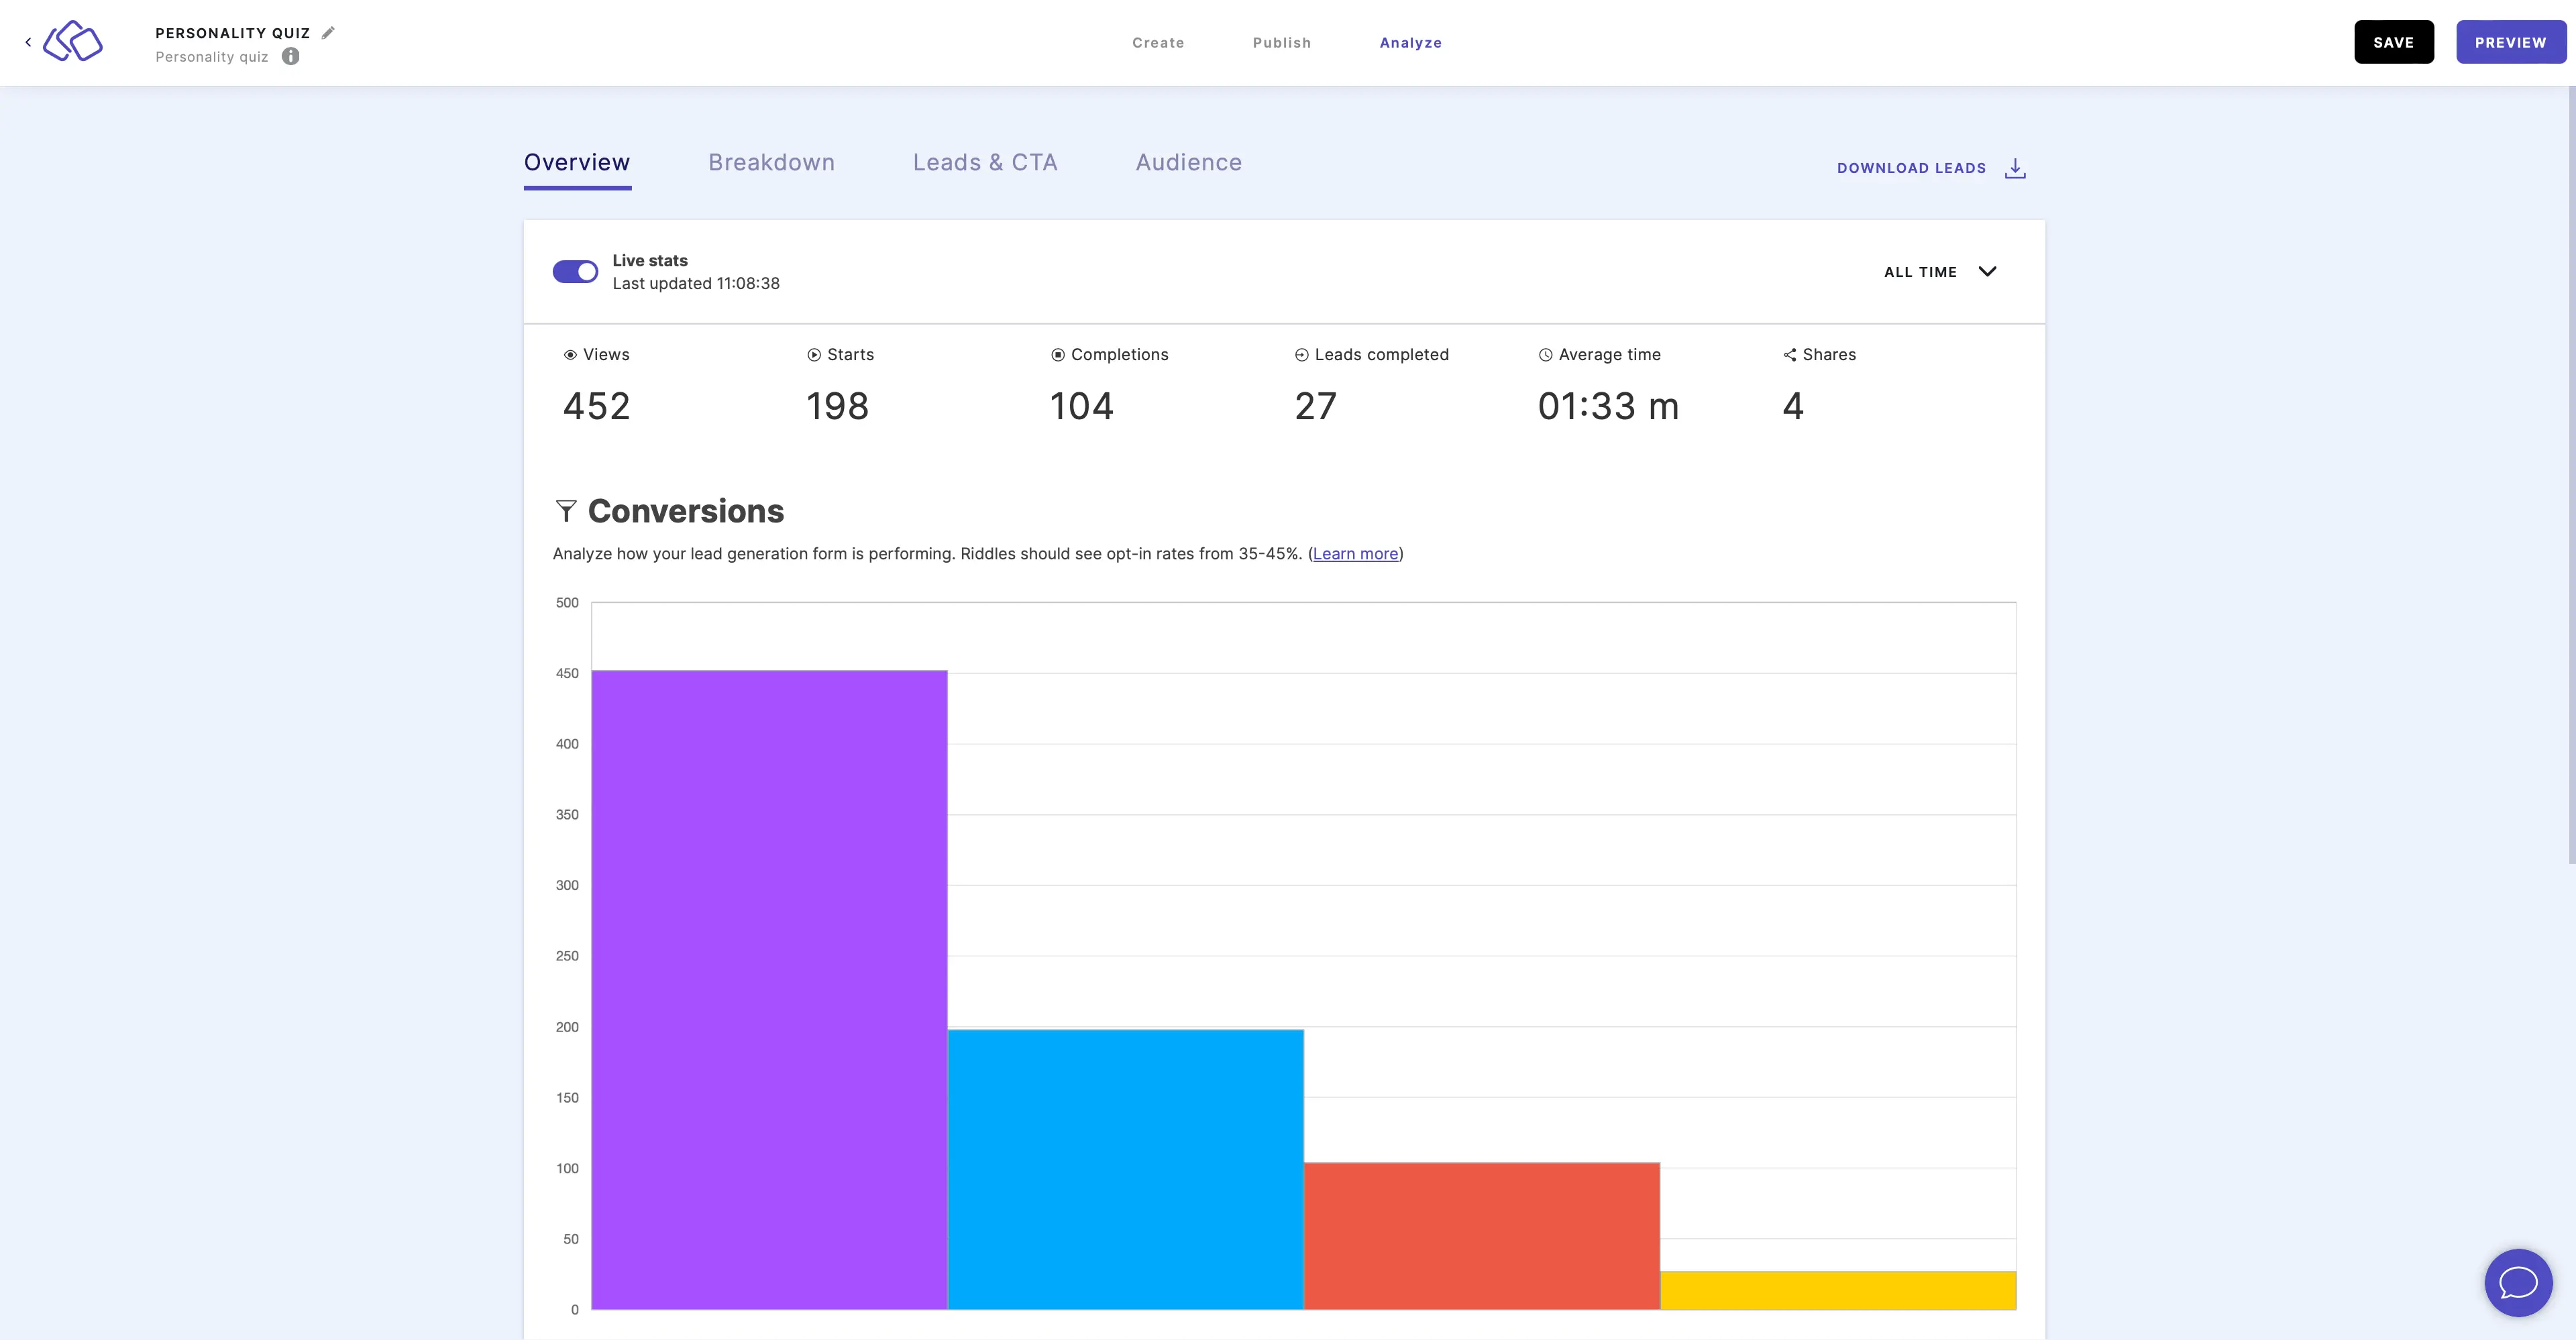
- Go to Analyze.
- Click on Leads & CTA.
- Click on DOWNLOAD LEADS.
- Select the format you would like your lead statistics to be in:
- CSV is a generic format which you can then open in a tool of your choice.
- XLSX is the native Excel format so it is easier to open in Excel.
- Done. The leads will download directly onto your device.
Understand downloaded leads sheet columns
In addition to showing you the data from every content / form block, your downloaded leads sheet also shows you other information.

- Timestamp (UTC)
This is the time when the Riddle was completed. - Time taken (ms)
This is the amount of miliseconds your audience spent on the Riddle. This time only includes question blocks. - Lead ID
This is a randomly generated code to identify this person.

