Manage your Riddle stats
Track how your audience interacts with your Riddle – from views and completions to individual answer breakdowns and lead conversion rates. Analytics are available for any published Riddle.
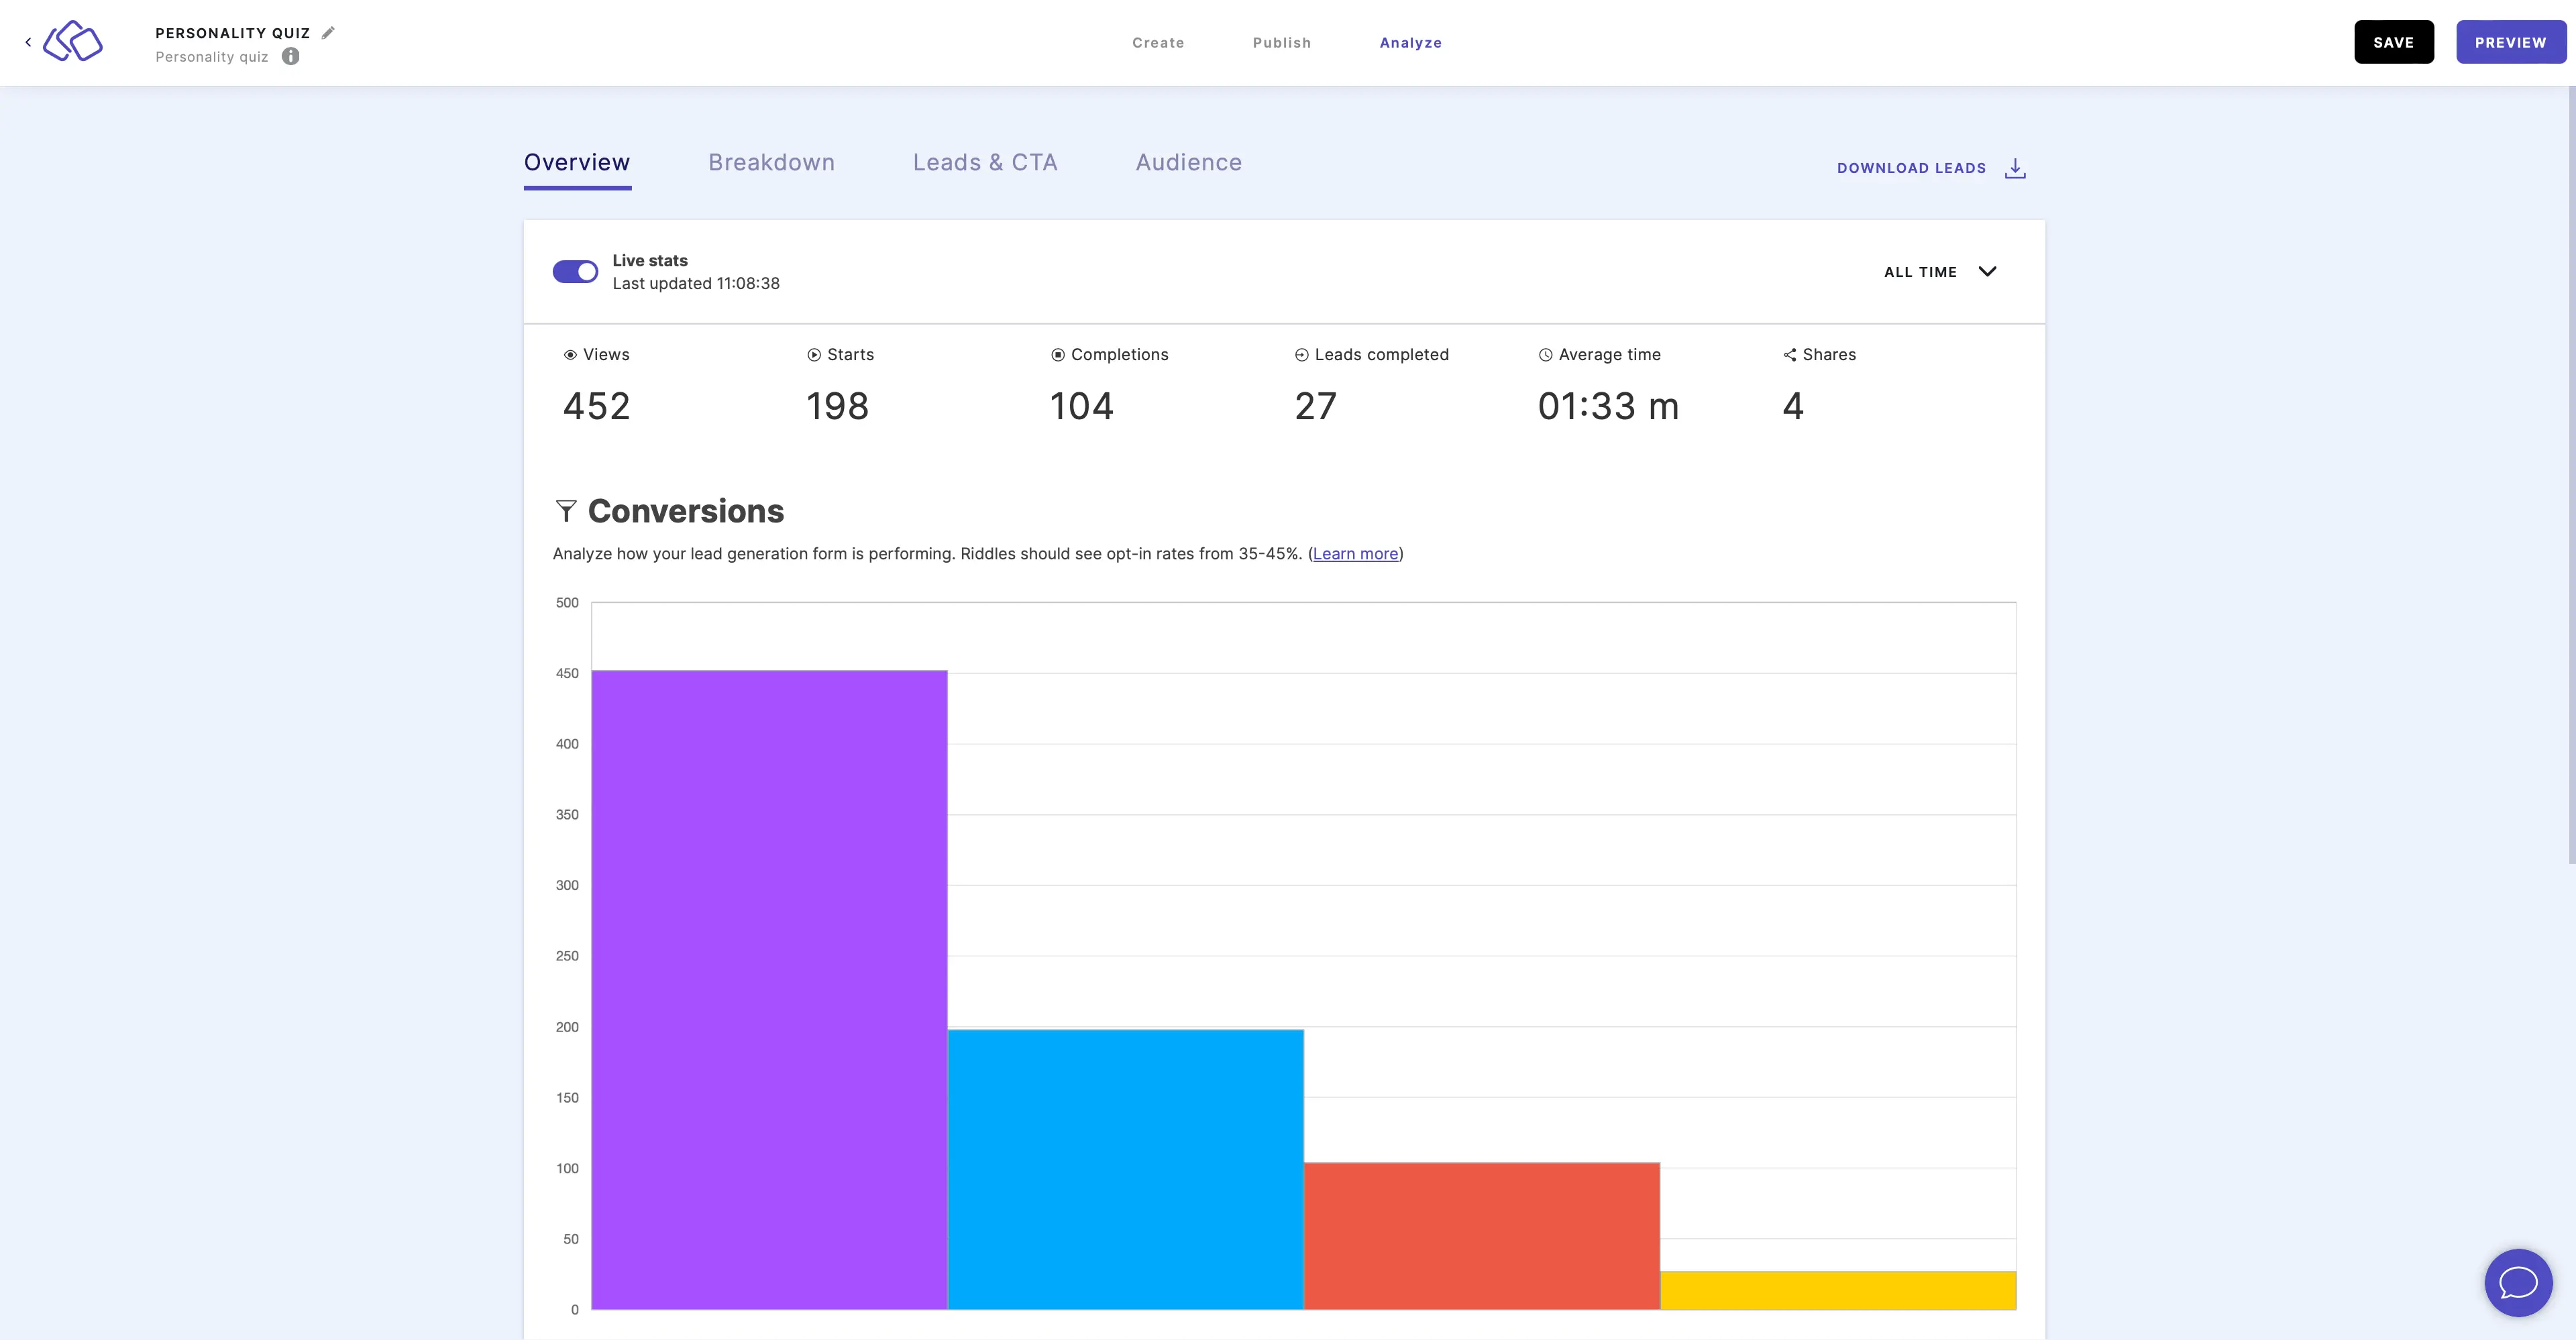
View stats
There are two ways to open stats:
- Open a Riddle and click on Analyze.

- Go to YOUR RIDDLES, hover over a Riddle and click on ANALYZE.

Download stats
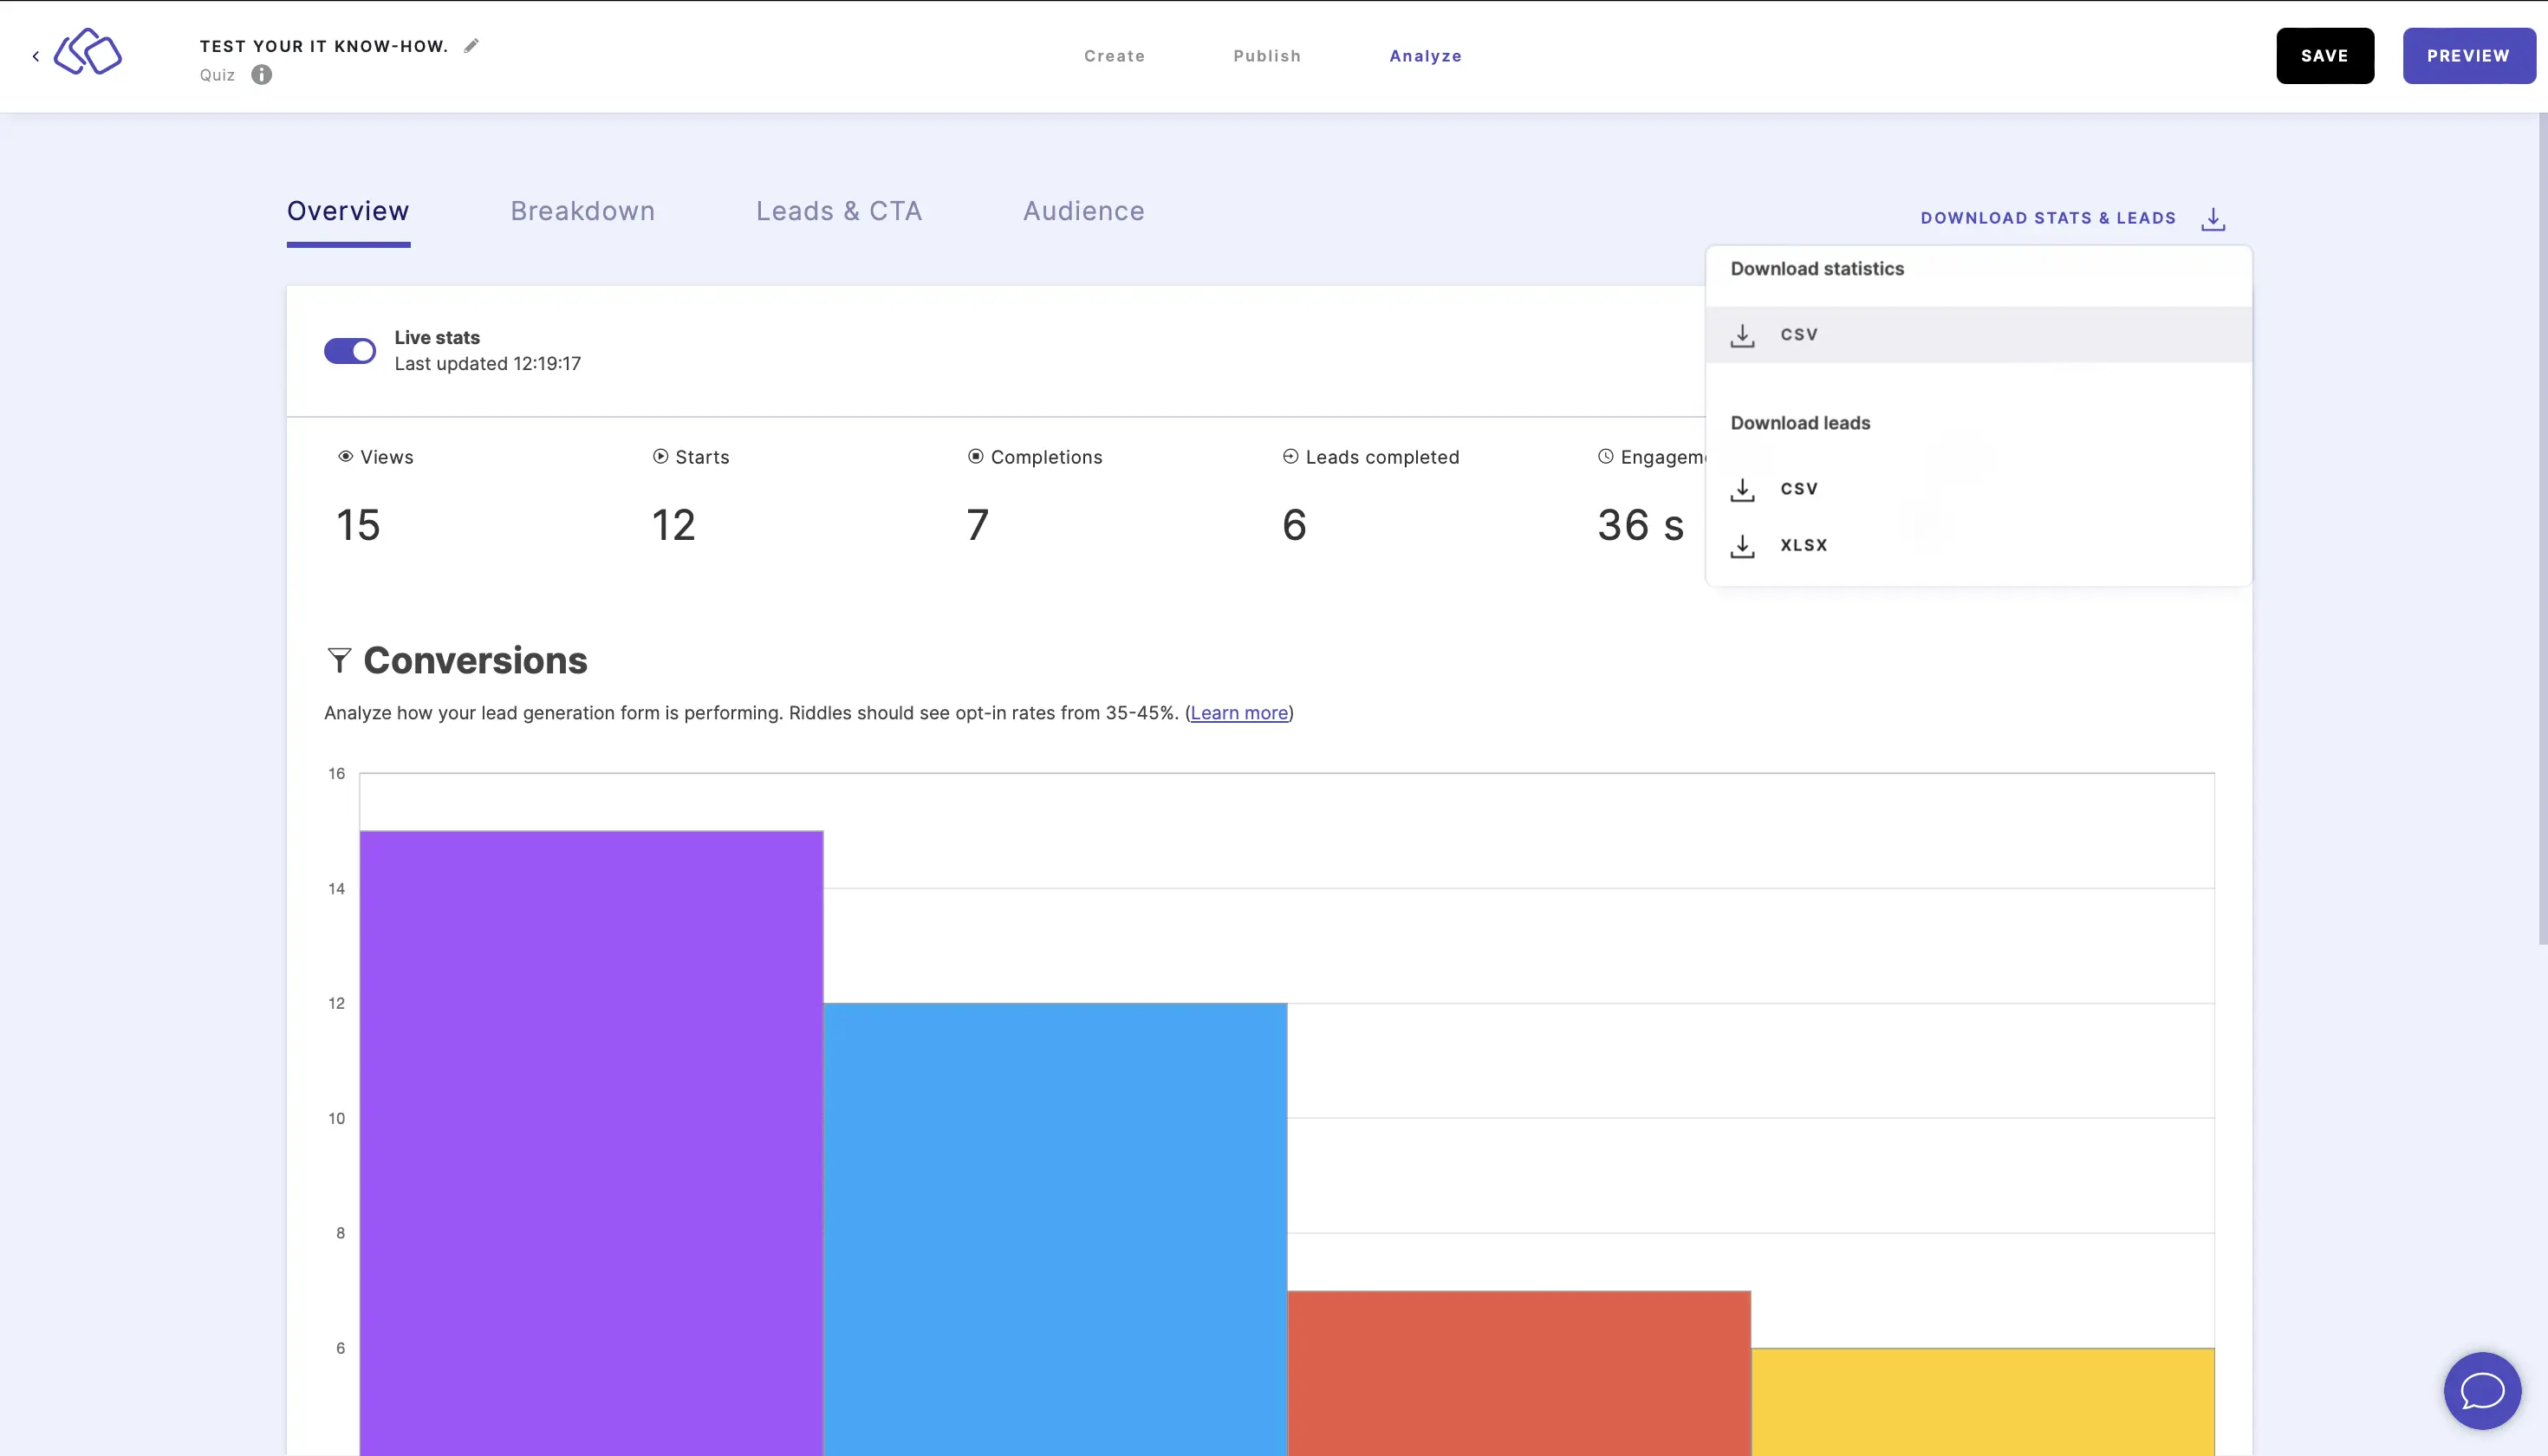
- Go to Analyze.
- Click on DOWNLOAD STATS & LEADS.
- Click on CSV under Download statistics.
- Done. The stats will be downloaded as a CSV file onto your device.
Download leads
- Go to Analyze.
- Click on DOWNLOAD STATS & LEADS.
- Click on CSV or XLSX under Download leads.
- Done. The leads will be downloaded as your chosen file type onto your device.
Note: If you have choices that contain a comma, these choices will be wrapped in quotation marks, so they don't break your import when working with your lead data.
Reset stats
You can reset stats from any given time period or reset all stats to zero for each Riddle. The data is then no longer stored on the Riddle server.
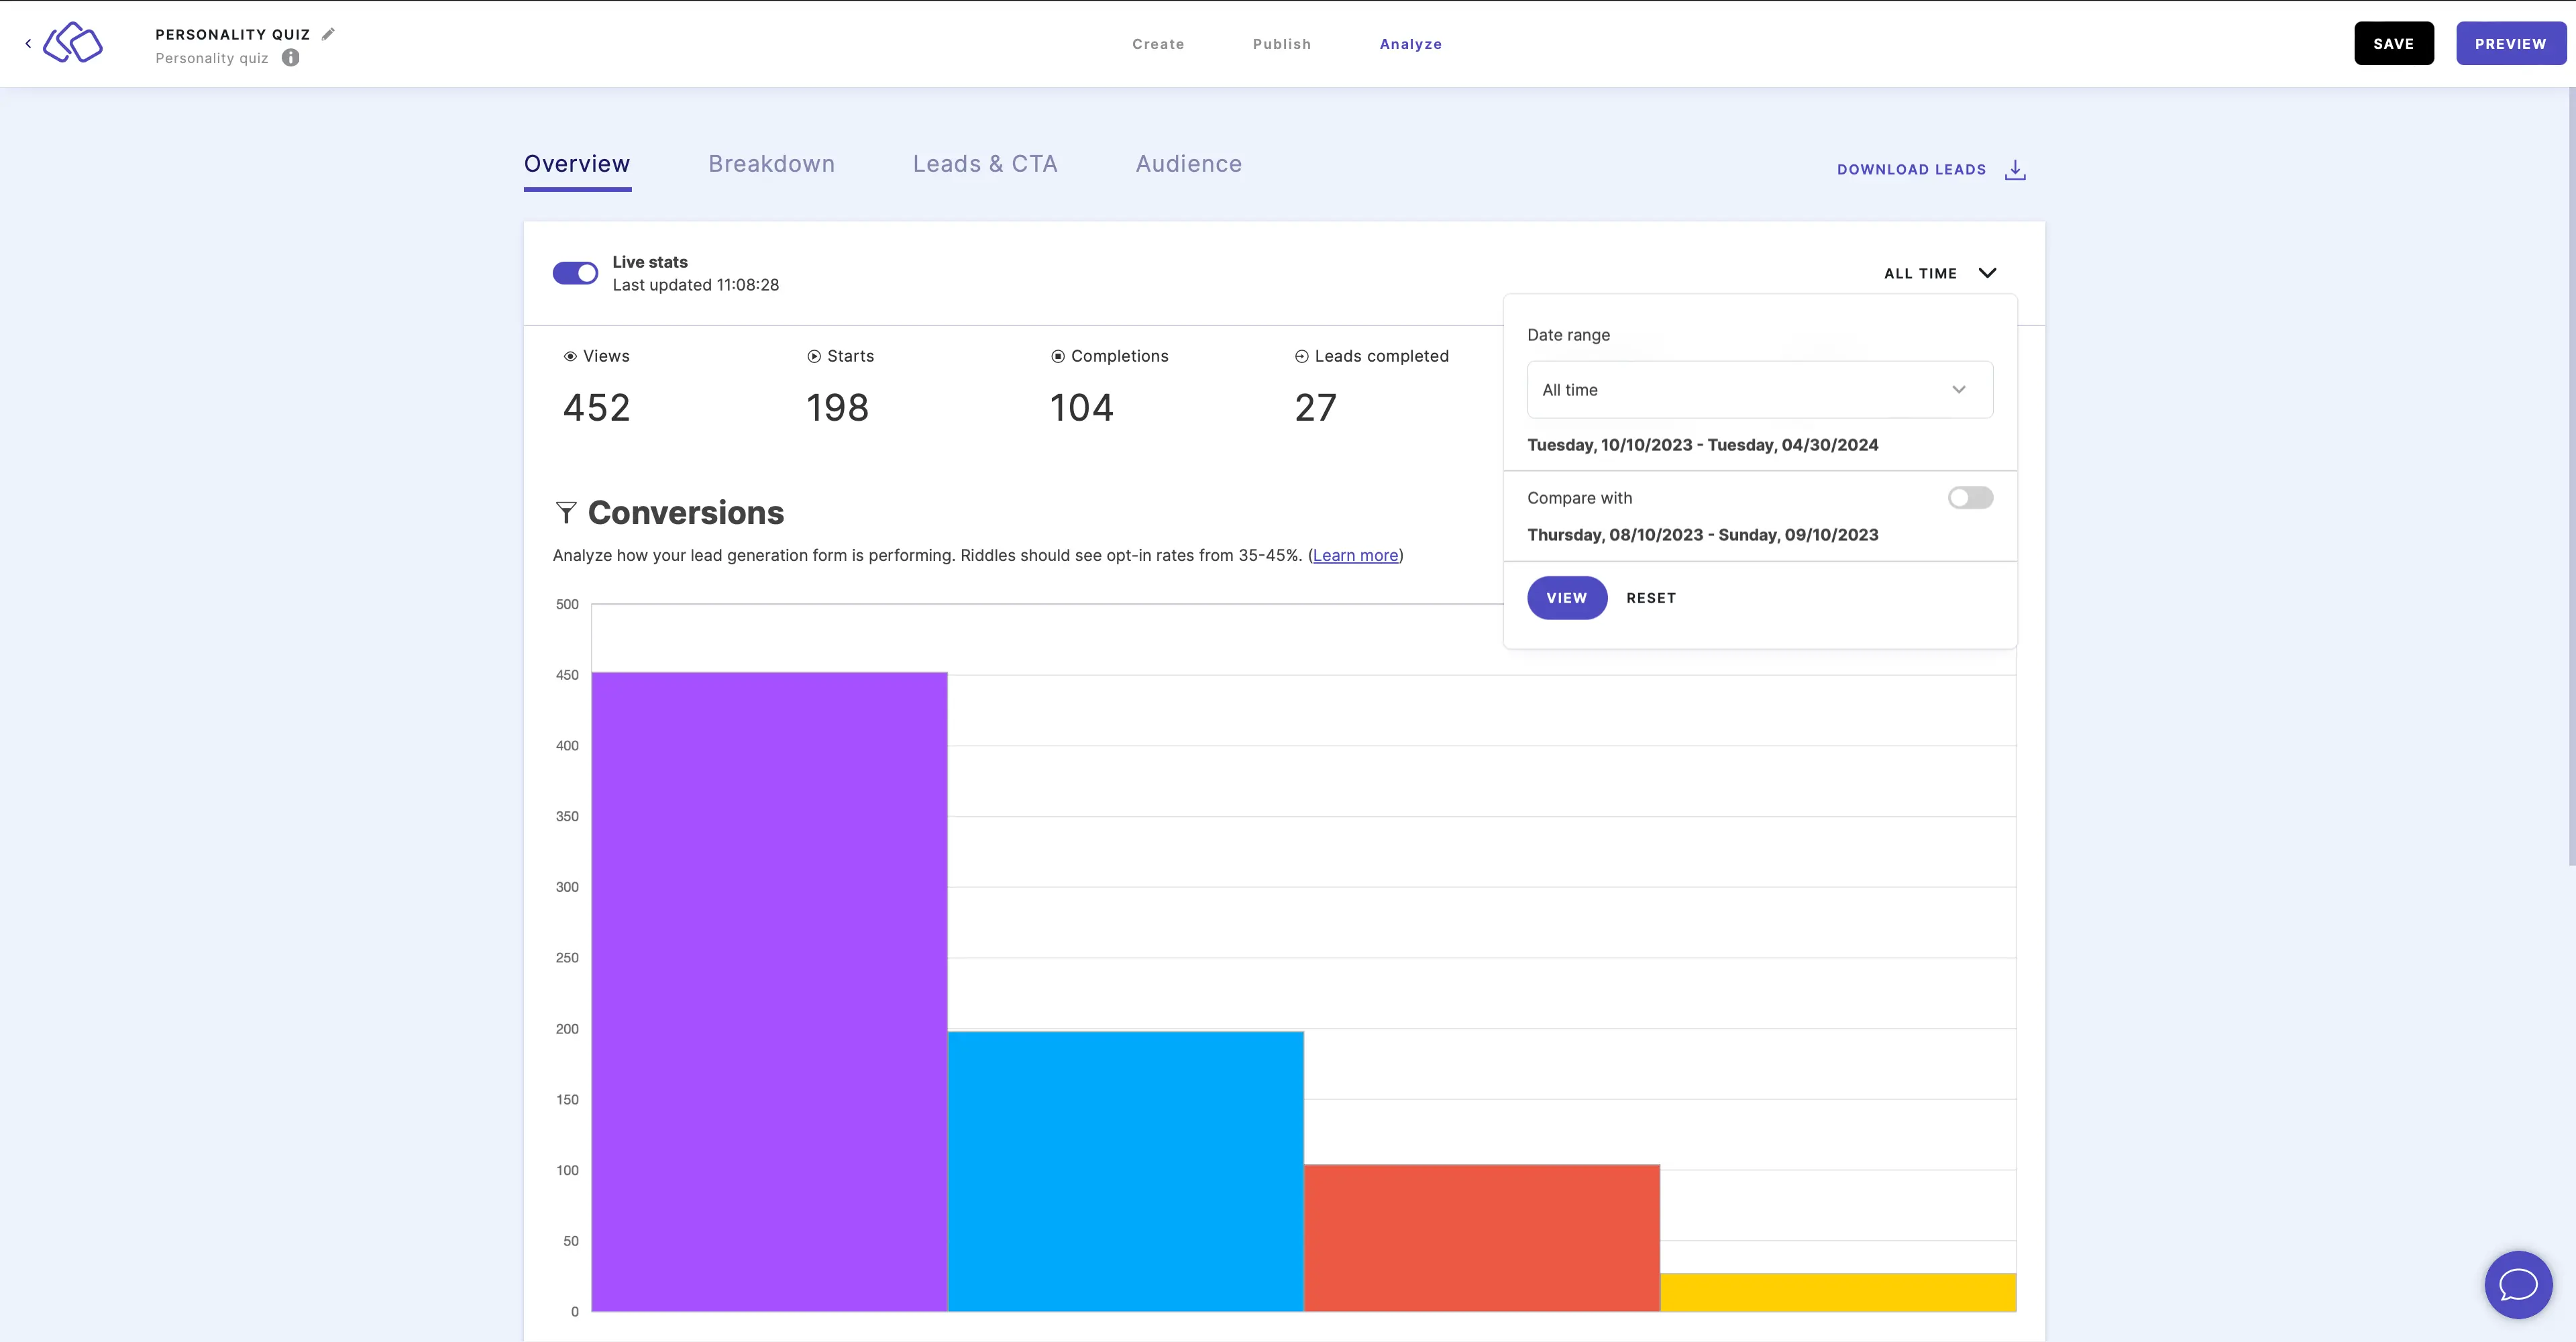
- Go to Analyze.
- Click on the three dots next to ALL TIME (or the time frame you selected).
- Click on RESET.
- In the pop-up, check the Yes, do it box and click on OK.
Export data
You can export your stats (and leads) to a software such as Google Sheets so that your stats update there automatically rather than only after downloading manually.
Go to the lead integration help guides and follow the steps for your chosen integration.
Understand your stats
There are four statistics categories.
- Under Overview you can see the following statistics as a line graph:
- Views
- Starts
- Completions
- Leads completed
- Average engagement time
- Shares
- Under Breakdown you can see the following statistics:
- Question completion as a bar chart with a bar for each block showing whether the block was answered/completed
- Answer breakdown as a line graphic showing how many and what percentage of people chose each answer option
- A color-coded breakdown of how many and what percentage of people had the right / wrong answer for each question (where applicable)
- Results as a line graph with a raw count and percentage for each result page
- Score breakdown with a raw count and percentage of people who scored which points
- Under Leads & CTA you can see the following statistics:
- Lead generation as a line graph broken down into:
- Leads
- Leads completed
- Leads uncompleted
- Unique leads
- Form breakdown as a graphic indicating which actions were performed for each form block as a line with percentages and raw data
- CTA breakdown as a line graph with a raw count and percentage for each CTA button
- Lead generation as a line graph broken down into:
- Under Audience you can see the following statistics:
- Regions as a pie chart and a table
- Device as a pie chart and a table
- Operating system as a pie chart and a table