Want to track your quiz statistics? We’ve got you covered – so you can see how well your quiz or other Riddle contents are performing.
Your Riddle quizzes are living, breathing bits of interactive awesomeness. When you create a quiz in our quiz maker, that’s just the start.
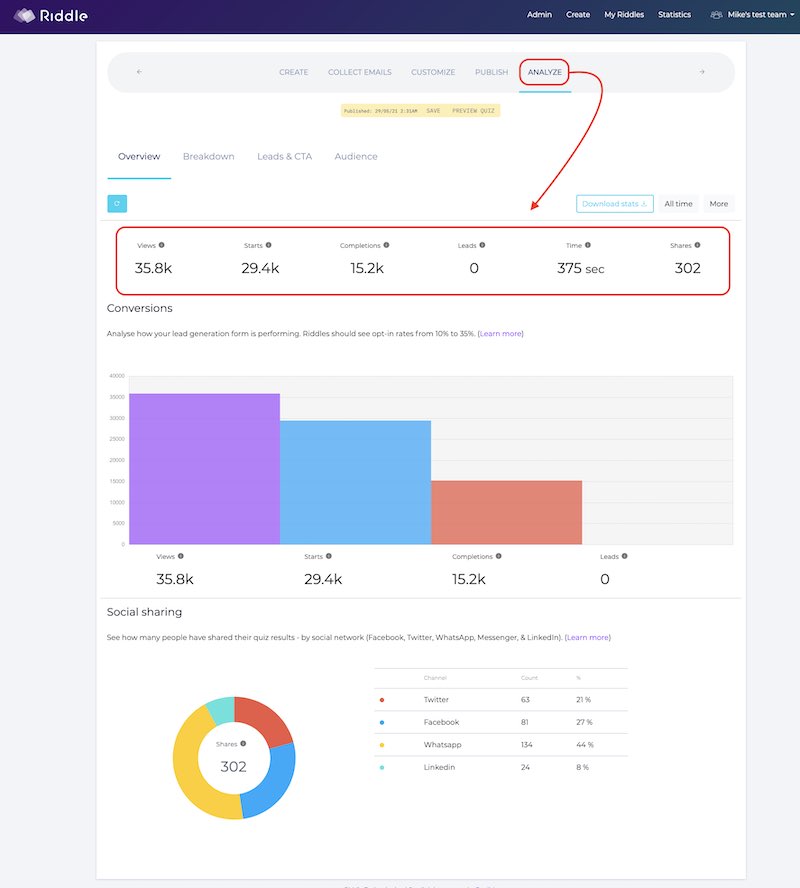
You can use the stats on our ‘Analyze’ step to improve your quiz, and make sure it’s effective with your audience.
Video: using your Riddle quiz statistics
Our co-founder Mike whipped up this handy video to walk you through the many options of our quiz statistics and analytics module:
What quiz statistics can you measure?
Our stat page shows the funnel of your user’s entire journey:
- Views: People who came across the quiz embedded on your site (they may or may not click on it)
- Engagements: # of people who clicked and interacted with your quiz
- Completions: # of people who finished it (answered the last question)
And of course:
- Shares: how many people shared across Facebook, Twitter, etc.
- Time on site: how long your quiz takers spend with your quiz (on average_
- Leads: # of people who completed your lead form
FAQ: Why does my quiz have more starts than views?
Occasionally, some of your quizzes might have lower ‘views’ than ‘starts’.
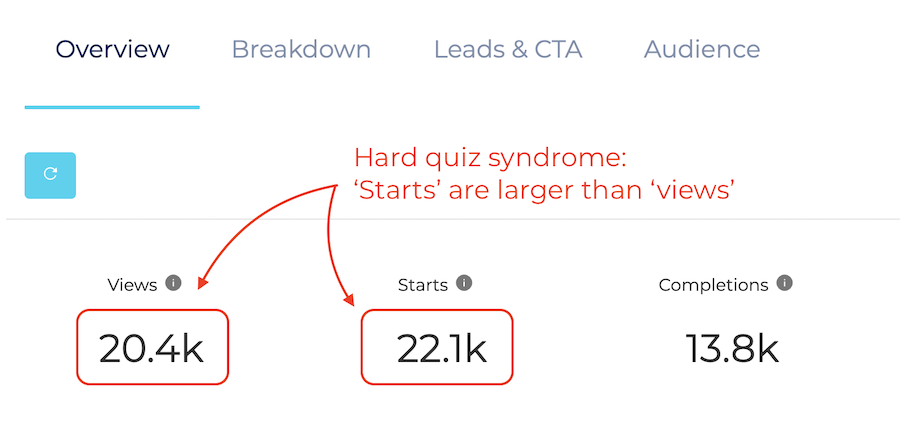
Don’t worry – that could seem a little weird, since more folks will land on your quiz page than click the ‘start’ button.
We call this ‘Hard Quiz Syndrome’ – if you’ve crafted a tough quiz, many of your users will choose the ‘play again’ button at the end, so they can better their results.
This only occurs rarely – and your quiz starts would increase +1, while views would stay the same.
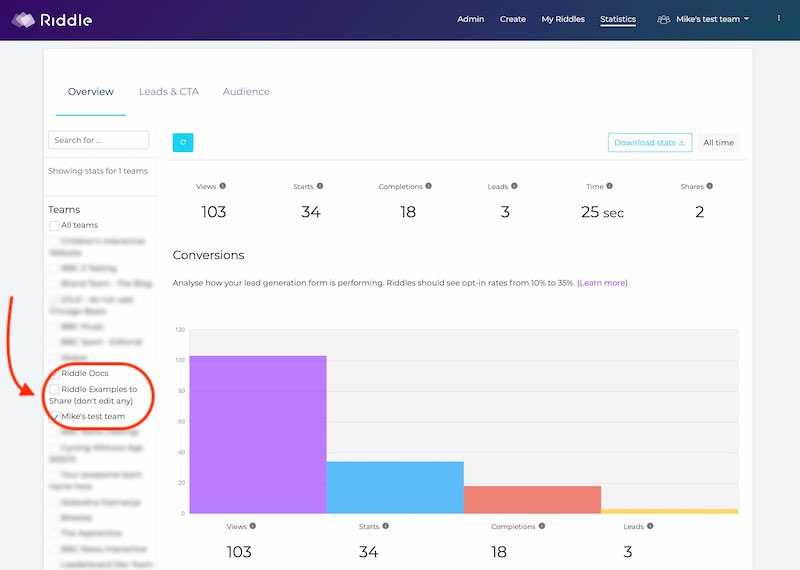
Quiz statistics – team or account-level
We’re really excited – you can now track how your quizzes at the team level. Measure your team’s performance – or get an account-wide perspective.
Team-level statistics
- Go to our statistics step – and select the team(s) you wish you view.
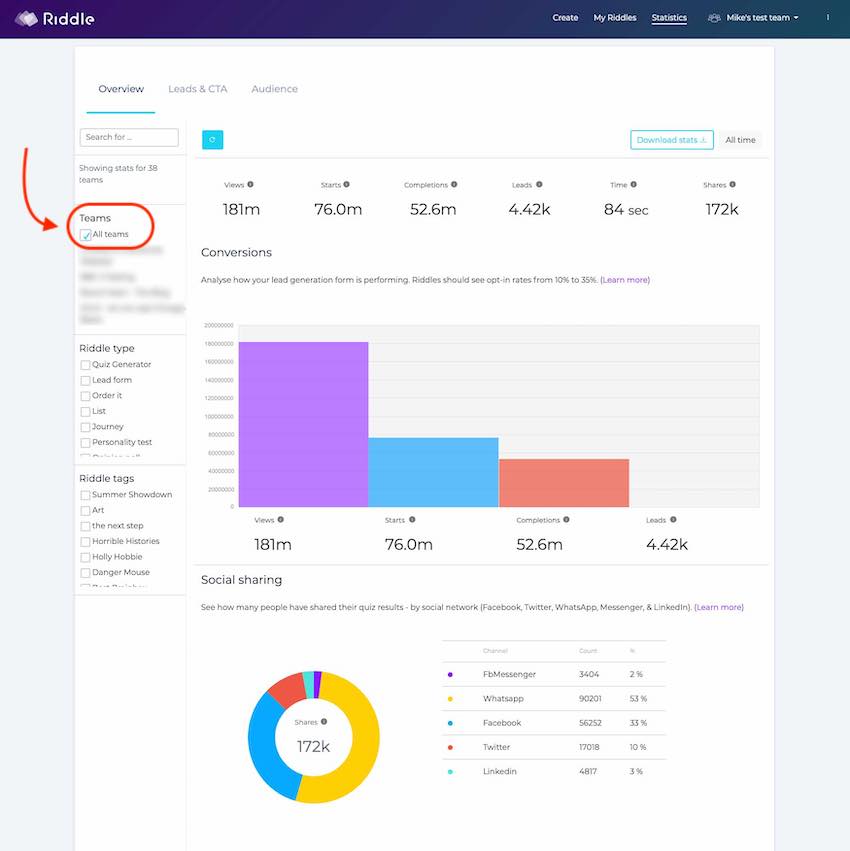
Account-level quiz statistics
- Go to our ‘statistics’ step
- Select ‘All teams’
Additional quiz statistics
You can also track loads of new data points, such as:
- Call to action button clicks
- Skipping lead form
- Sharing by social network
- And many more
Plus – you can now view/compare your quiz stats on a daily basis. This is a big, big improvement to our quiz maker – before, you could only see your lifetime quiz stats.
Use stats to optimize your quiz:
You can use our statistics module in our quiz maker to improve your Riddle quizzes.
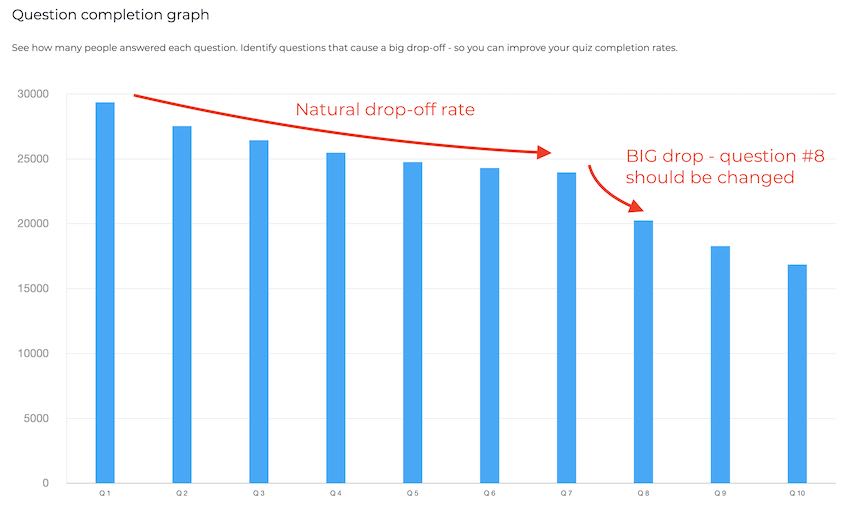
One common use case? Improving your quiz completion rate with our question funnel graph.
- For example, if the your completion % is low, you know that you should try a different image or title for the quiz, to get people clicking.
- If the completion rate falls below 70%, you can look at our question by question waterfall graph, and see if there’s a question causing many people to leave.
- In this example, there’s a noticeable drop at question #8 – this question should be improved to keep quiz takers interested.
Good statistics benchmarks
- Completion rate: 70% is a good target, but we’ve seen many quizzes go as high as 85%
- Share rate: 3-4% is a solid share percentage. Is yours lower? Try more compelling ‘result’ text – make them funny/engaging so people want to share.
- Time on site: quizzes are rock stars at engaging site visitors. An average Riddle quiz or personality test will spend about 3 minutes 34 seconds on a page – that 56% better than the internet average of 2 minutes 17 seconds. Single questions polls and the like will be less – but the key takeaway is that site visitors that click are site visitors that stay (longer).
- Lead completion: 8-9% is normal, but we’ve seen upwards of 32% with a good call to action. The secret? Go beyond ‘sign up for my newsletter’ (yawn!). Give each user a ‘too good to miss’ reason to sign up – from a special discount offer to a free 15 minute Skype consultation or a giveaway.
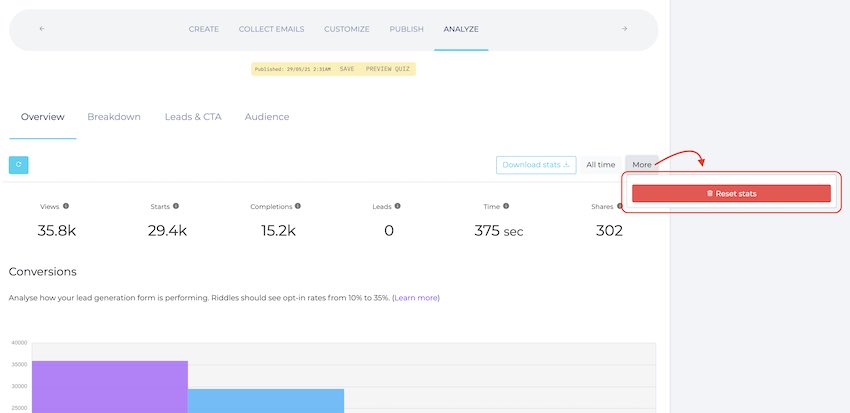
Reset your stats
Testing is a key part of any successful quiz – you should definitely share your quiz with coworkers and friends to see what they think.
But before you launch your quiz to the world, use our ‘reset quiz stats’ option so your quiz statistics do not include data from your test audience.
Want to learn more?
Check out our blog post ‘Understanding Riddle statistics’ or grab our free ebook ‘Quizmaster’ – chock full of our quiz tips and best practices from our 35 years combined quiz expertise.
*************
Video transcript
(We know that some folks prefer to quickly skim a video transcript vs. watching our whole walkthrough video. So we’ve added this handy text version.)
Hi there, my name’s Mike and I’m one of the co-founders here at Riddle and in this video, I’m going to give you a quick overview of our quiz statistics options. We have the per quiz statistics, which you can look at in our ‘Analyze’ step, or you can also dove into our statistics module and actually see them that way.
I’m going to go back to my Riddle quiz and you’ll see here that we have this nice funnel view, which is designed to give you kind of that Goldilocks amount of information – just what you need to see how your quiz is doing.
First off, let’s cover some definitions.
- Views: we count a quiz view as when people land on a page and see your Riddle content, a quiz, a poll survey they may or may not decide to engage.
- Starts: This is when people click onand they’re engaging with your quiz. So starts will always be a little smaller than views.
- Completes: A quiz complete is when someone finishes the last question of your quiz experience. Now, remember, our lead form comes after that. So they may complete a quiz, see the lead form and go, oh, maybe I don’t want to fill it out. That still counts as a quiz complete.
- Leads: Okay, this obviously where people fill in, decide to fill in your lead form.
- Time taken: We also track the average time it takes for people to finish your quiz
- Social shares: And then we also track social shares. We give you this nice funnel feature and then you can see in this in this level where people are sharing your content on social,
(As a benchmark, we recommend 3-4% is a good goal to use when saying, “hey, how many shares am I getting?”)
Next up – we also have this handy breakdown tab, which will show how many people got the perfect score. So on and also where people are leaving the quiz. And then a question by question breakdown.
You also have a tab focused on your lead form’s performance – this quiz did not have leads or did not have a lead form. So it’s going to be empty of data.
We also provide this little handy information of where people taking my quiz now due to data privacy regulations like the GDPR, we don’t actually use IP addresses to track this.
We just use browser language – it’s more of an estimate than an actual hard number, but it’s just a nice guide. In this case, a lot of my folks are coming from the UK or Great Britain and a lot of those folks coming from the US.
Now, let’s dive back into our quiz statistics and how you can use this to optimize your quiz.
These numbers can tell a lot about your quiz – for example, looking at views to starts, if this ratio is quite low, if very few people are starting your quiz to me, that would tell me that I need to improve my quiz title or my quiz main image.
Your title image and quiz title are like the cover of a book. And that’s what’s going to get people to actually want to start your quiz. So if this number is really low, you might want to improve that aspect of your quiz.
Now, in terms of quiz completions, we recommend 70% as a good target for your quiz completion rate. If it goes below that, then we have this little feature here, which is our “Question completion graph”. And this is quite useful because sometimes you’ll notice if there’s a marked drop off at a particular question.
For some reason, at a certain question, people are going to are going to lose interest.
In most quizzes, there is a nice general waterfall approach. You’re going to see people gradually tapering off – and that’s totally natural. What you’re looking for is a sharp drop. And if that happens, you’re going to say, OK, well, maybe that question just isn’t getting people – it’s are not engaging them. Maybe I should change that.
The other thing you can do is seeing if your quiz is too long. Fo rexample, we’ve seen people who have had a 60 question quiz, which is a very long experience.
And you can see where people drop off because, you know, we recommend six to ten questions is good for most use cases – for more serious quizzes, 20, you might even get 30.
But after that, it’s going to be really hard to get people. So you’ll see people taking your quiz. And maybe after ten questions, 15 or 20 or whatever, you’re going to see a huge drop off.
Then, you’ll know, OK, this is where I could improve my quiz.
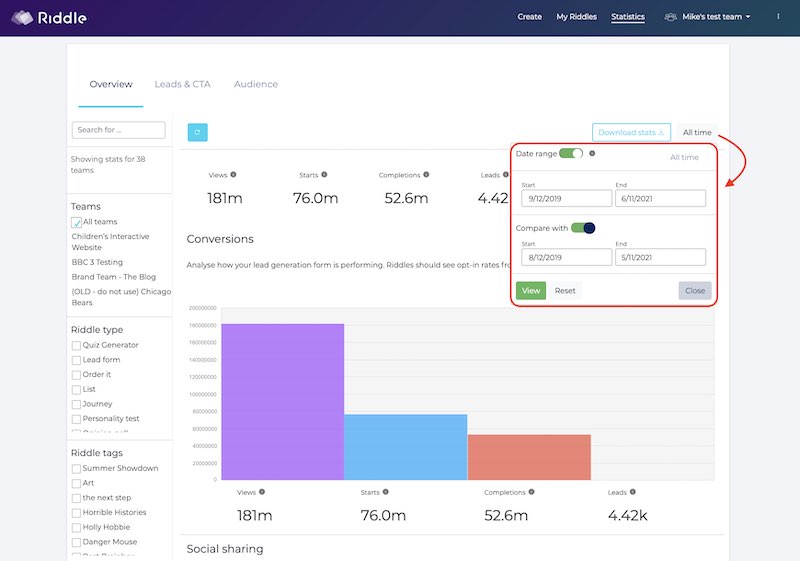
You can also compare date ranges if you want to compare last week to this week or and things like that. You can also (if you’re on a pro or team account) download all this juicy data as a CSV file.
OK, so that’s our perquisite basis per quiz module.
We also give you this handy kind of account level view in our statistics.
And in this case, I’m going to select all teams. And you’ll see here this is a lot of quiz statistics because I work with a lot of different teams. You to see we’ve got one hundred and eighty two million views and a lot of starts and jeez, a heck of a lot of completions.
But this is a nice way to see how you’re doing overall. And again, we’ve got leads and audience – plus you can dive into a particular type of Riddle content, particular teams, and the like.
So right now, I’m just looking at Personality tests – in this case, you can say, “Well, I want to compare how my personality test have done last week versus the week before.”
We give you this nice graph which lets you quickly discover that this first week did a little bit better.
So that is our rather robust quiz module. If you have any questions about using quiz statistics to help optimize your quiz or just using our analytics to help you out, please use our support chat.
And you’ve probably heard me blather on about this in many videos before, but we’re really proud of this.
My co-founder Boris and I – we actually run the support with our entire team. We don’t outsource, use bots, or have a support team.
Our developers, our founders, our entire team answer questions and we race each other to be the fastest to respond. So if you have any questions, we’ll get you an answer mostly within two minutes, because there’s beer involved and that inspires a certain amount of speed on our side.
Anyways, that’s quiz analytics. That’s Riddle.
And any questions? I look forward to seeing you on chat.
Thanks so much. And Happy Riddling!