
Quick answer: Quiz analytics turn interactive content from a play counter into a source of decisions and leads. Riddle tracks views, completions, drop-off, and leads on every quiz automatically, and lets you collect and share the data five ways: dashboard, Stats API, webhooks, event tracking, and an AI-ready MCP connector.
You can collect and share that data five ways – a no-code dashboard, a five-endpoint Stats API, real-time webhooks, event streams into tools like GA4, Meta, Matomo, Adobe, and Looker Studio, and the Riddle MCP, which lets Claude, ChatGPT, and other AI tools pull your quiz analytics and build reports on their own.
Why analytics matter for interactive content
A quiz that pulls 40,000 plays looks like a win. But the play count alone can’t tell you whether the quiz did its job, or how to make the next one better. The value is in the detail underneath it.
Good quiz analytics answer the questions that actually change outcomes:
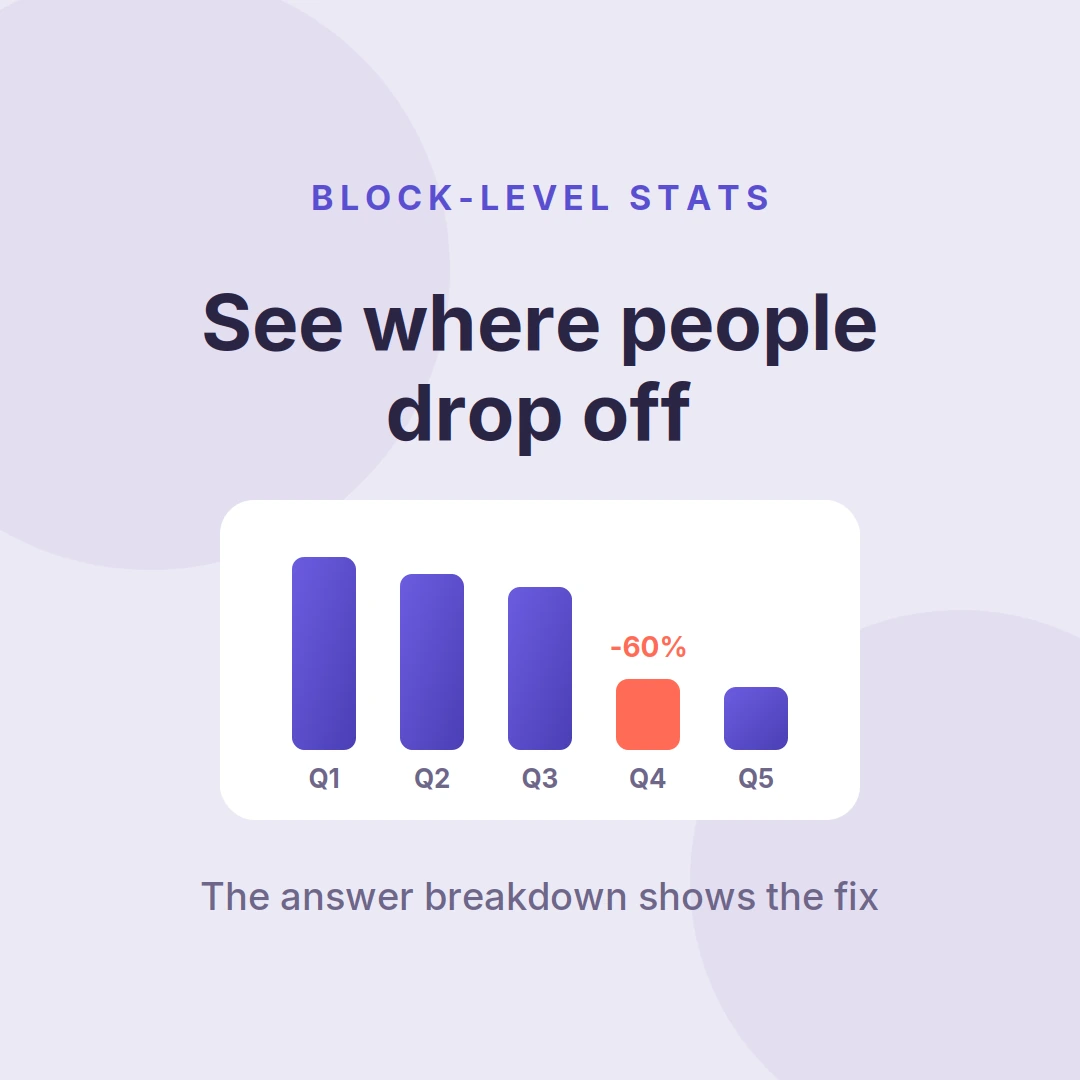
- Where do people drop off? If 60 percent of players quit on question four, that is a fixable problem – but only if you can see it. A single completion-rate number hides it; an answer-by-answer breakdown exposes it.
- Which content converts? Knowing whether quizzes, surveys, or personality tests capture more leads tells editorial what to make more of.
- Where do the leads come from? Tying each captured lead back to the campaign that drove it turns interactive content into a measurable acquisition channel, not a guess.
- Is it working over time? Trends across weeks and across your sites show whether the format is compounding or fading.
Without this, interactive content is a cost center you hope is working. With it, every quiz is an experiment that makes the next one sharper and the business case easier to defend.
What is Riddle?
Riddle is an interactive content platform used by publishers and media companies including the BBC, CNN, SRF, and Sports Illustrated. From one no-code builder, teams create 35+ content formats – quizzes, polls, surveys, personality tests, score predictors, leaderboards, forms, and NYT-style mini-games – and can generate them with AI from an article URL or a topic, or build them programmatically through the API.
What sets Riddle apart is that quiz analytics is a core feature, and not merely an afterthought. Most quiz makers ship a basic play counter and reserve real analytics – API access, webhooks, BI connectors – for their top tier, if they offer them at all.
Riddle builds quiz analytics into every plan:
- On every plan: the dashboard, CSV and XLSX exports, real-time webhooks, and the AI-ready MCP connector
- With Business and up: the Stats API and full event tracking – integrate directly with your data tools
- Included with Enterprise: Looker/Google Data Studio native integration
How does Riddle compare to other quiz makers on analytics?
Riddle offers quiz analytics capabilities that most interactive-content tools reserve for their top tier or don’t offer at all: real-time webhooks and the AI-ready MCP connector on every plan, a five-endpoint Stats API and full event tracking on the Business and Enterprise plans, and a Looker Studio connector on Enterprise.
The table below compares Riddle with other well-known quiz and interactive content makers on the analytics features that matter most for publishers and brands.
| Analytics capability | Riddle | Typeform | Outgrow | Interact | Jotform | LeadQuizzes | Opinion Stage | involve.me |
|---|---|---|---|---|---|---|---|---|
| No-code analytics dashboard | Yes | Yes | Yes | Yes | Yes | Yes | Yes | Yes |
| Answer-level / question drop-off | Yes | Partial | Yes | Yes | Partial | Yes | Yes | Yes |
| CSV / XLSX export | Yes | Yes | Yes | Yes | Yes | Yes | Yes | Yes |
| Stats API (pull data programmatically) | Yes (Business) | Partial | Partial | No | Partial | No | No | Limited |
| Real-time webhooks | Yes, all plans | Higher tiers | Higher tiers | No | Yes | No | No | Higher tiers |
| AI-ready MCP connector (Claude, ChatGPT, etc.) | Yes | No | No | No | No | No | No | No |
| GA4 / GTM / Meta / Matomo / Adobe | Yes (Business) | Partial | Partial | Partial | Partial | Partial | Partial | Gated to paid |
| Raw JS event stream to any tool | Yes (Business) | No | No | No | No | No | No | No |
| Looker / Google Data Studio connector | Yes (Enterprise) | No | No | No | No | No | No | No |
| Data Layer with UTM pass-through to leads | Yes | Partial | Partial | Partial | Partial | Partial | Partial | Partial |
| Unlimited views / no monthly response cap | Yes | Capped | Capped | Capped | Capped | Capped | Capped | Capped |
| Serve your own in-content ads | Yes | No | No | No | No | No | Partial | No |
| EU-based / 100% GDPR-compliant | Yes | Partial | No | No | Partial | No | No | Partial |
Comparison based on publicly listed features as of 2026. Competitor plans and features change often – check each provider’s current pricing page before deciding.
For most providers, the quiz analytics building blocks a publisher or brand needs to automate reporting – API access, webhooks, a raw event stream, a BI connector, in-content ad serving, and no caps on views or responses – are either missing or locked behind the highest tier.
Riddle puts webhooks and the MCP connector on every plan, and offers the Stats API and event tracking on Business and the Looker connector on Enterprise.
What data does Riddle track?
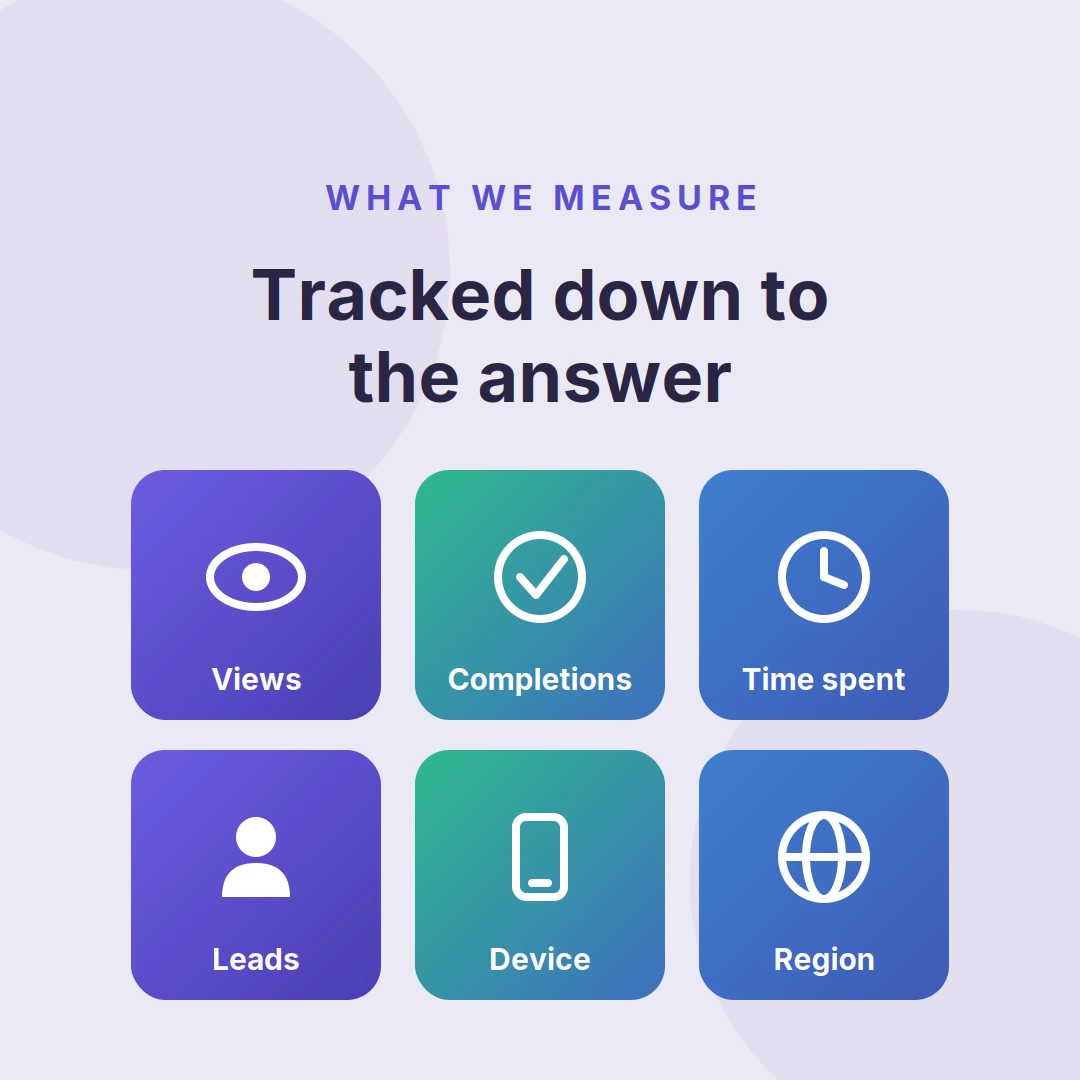
Riddle tracks every interaction with a published quiz, poll, or other Riddle automatically, with no setup or tagging required. The metrics fall into two levels: global stats for the whole Riddle, and block-level stats for each individual question, form, and result page.
Detailed stats (per Riddle quiz and other interactive content)
- Views – how many times the Riddle loaded
- Starts – how many people began
- Finishes – how many completed it
- Time and active time – total and engaged time, tracked in milliseconds
- Leads and completed leads – forms captured, and how many were fully completed
- Device – mobile versus desktop
- Operating system – iOS, Windows, Mac OS, and more
- Region – two-character country codes like GB, DE, US
- Domain – the site where the Riddle was actually viewed, so your own plays are separate from anywhere it’s embedded or shared
Block-level stats
Every block in a Riddle carries its own data:
- Questions – view count plus exactly how many times each answer was chosen
- Forms – submissions versus skips
- Result pages – views and any social shares
That block-level detail is where decisions come from. Aggregate completion rate tells you something is off. The answer breakdown tells you it’s question four, where 60 percent of players drop out. One number is a symptom. The other is a fix.
Quiz analytics in action: how Sport.de boosted start rates by 89%
Brands and publishers ask us this a lot – “How can we measure and optimize our sites’ interactive content campaigns?”
Sport.de – a large German sports publisher – is a huge fan of using Riddle’s quizzes, polls, and other interactive formats to increase dwell time and overall engagement. They use Riddle’s quiz analytics platform to iterate and improve every quiz they publish – it reveals easy-to-fix, high-impact changes that boost engagement.
For example, they noticed their ‘views to starts’ rate was low for a particular quiz – a deeper dive revealed that the editors had used a portrait format (not landscape) main image. With 82% of their traffic on smartphones, the button was below the fold and easily missed. Changing that increased the start rate by 55.7% – and a subsequent experiment of removing the cover page and leading with question one saw an 89% gain over the original.
Creating compelling content is only half of the process – you need solid quiz analytics to discover key ways to improve your interactive content’s performance.
We love Sport.de’s approach – using quiz analytics to evaluate experiments is the key to optimizing interactive content. You can see more of Riddle’s experiments below.
Five ways to collect and share your quiz analytics
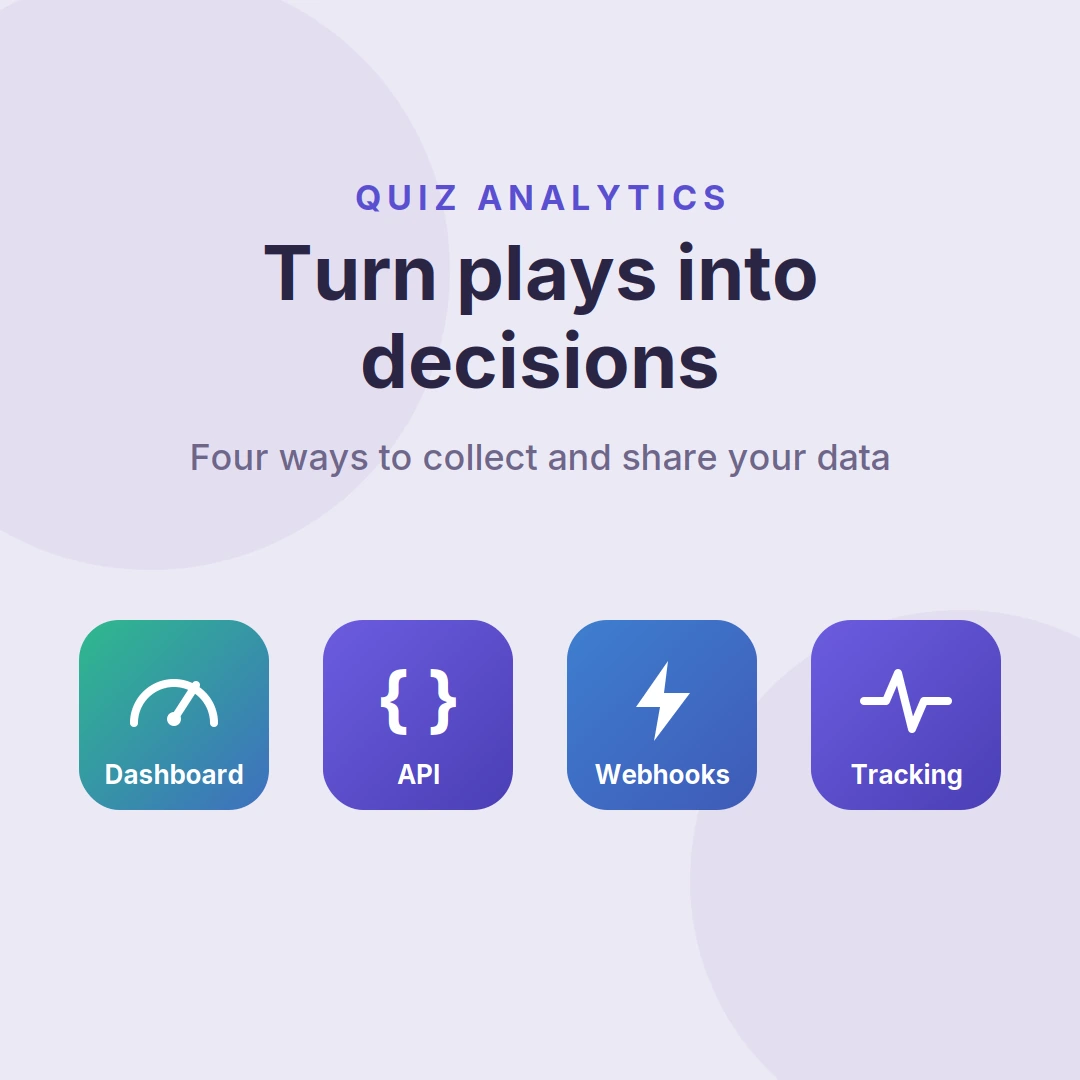
The same underlying data is available at whatever level of sophistication a team needs. There are five ways in: the dashboard for people, the Stats API for systems, webhooks for real-time delivery, event tracking for your existing analytics and BI tools, and the Riddle MCP for AI tools. Here is how each one works.
1. The dashboard: analytics for everyone, no code
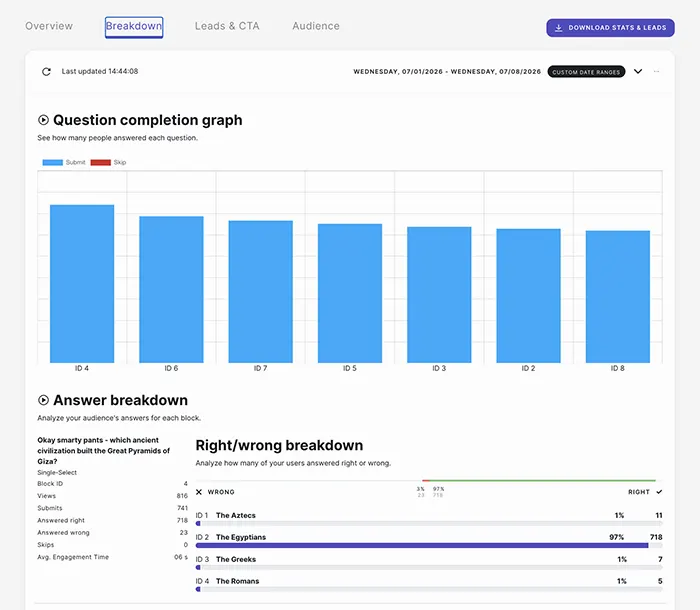
Every published Riddle has a no-code quiz analytics dashboard, available to anyone on the team without writing code. It shows views, starts, completions, individual answer breakdowns, and lead conversion rates for that Riddle.
To view stats
- Open a Riddle and click Analyze, or
- Go to Your Riddles, hover over a Riddle, and click Analyze
You’ll see the numbers laid out so any editor or campaign manager can read performance at a glance.
To export
- Click Download Stats & Leads
- Choose CSV for statistics, or CSV or XLSX for lead data
- Import-ready by default – if any answer choices contain a comma, Riddle wraps them in quotation marks so nothing breaks on import
A built-in safety net
If you reset stats on a Riddle – say, relaunching a campaign with a clean baseline – the old numbers aren’t deleted:
- They move into a separate reset store
- They’re hidden from the dashboard, not lost
- You start fresh without throwing away history
For many teams, dashboard plus CSV export is the whole workflow. When you’re running interactive content at real volume, you’ll want the data to move on its own – which is where the next three methods come in.
2. The Stats API: pull your data programmatically
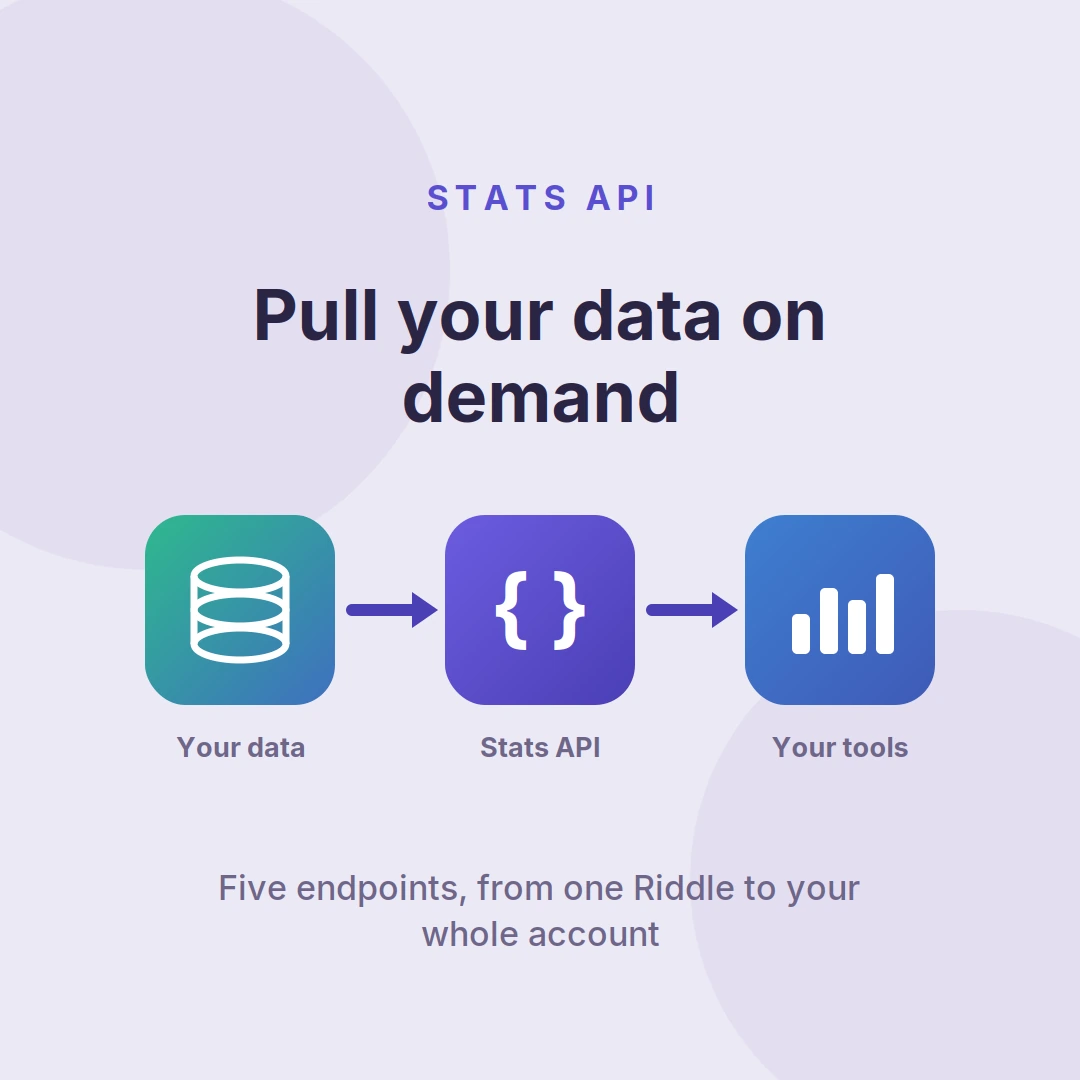
The Riddle Stats API lets you retrieve quiz analytics for any Riddle, project, or your whole account programmatically, without opening the dashboard. It is available on the Business and Enterprise plans. Everything you see in the dashboard is available through the API, plus account-wide roll-ups that aren’t practical to compile by hand.
You authenticate with an API key created in your Riddle account, then work with five endpoints, each shaped for a specific job:
- Fetch – raw stats for one Riddle, project, or user. Set a namespace (
riddle,project, or personal) and an entity ID, and scope to any date range withdateFromanddateTo. - Overview fetch – the same data split into multiple points across your date range. Ask for a month, get a series of points. This is the endpoint for trend charts, since it buckets the time for you.
- Breakdown – a detailed, human-readable view of a single Riddle with real question text and choice names attached, not raw IDs. Ideal for reports non-developers will read.
- Project breakdown – the same detailed view across every Riddle in a project in one call, so you can compare Riddle by Riddle.
- User breakdown – the widest view: every Riddle in every project on the account. Heaviest call, so bound it with dates on large accounts.
Responses are clean and consistent: a global_stats object with core metrics plus device, OS, region, and domain splits; a stats object per block with answer counts; a reset_stats object if any resets have happened; and, for breakdowns, readable titles on every metric so mapping counts back to questions is trivial. Full endpoint details are in the Stats API documentation.
3. Webhooks: real-time data the moment it happens
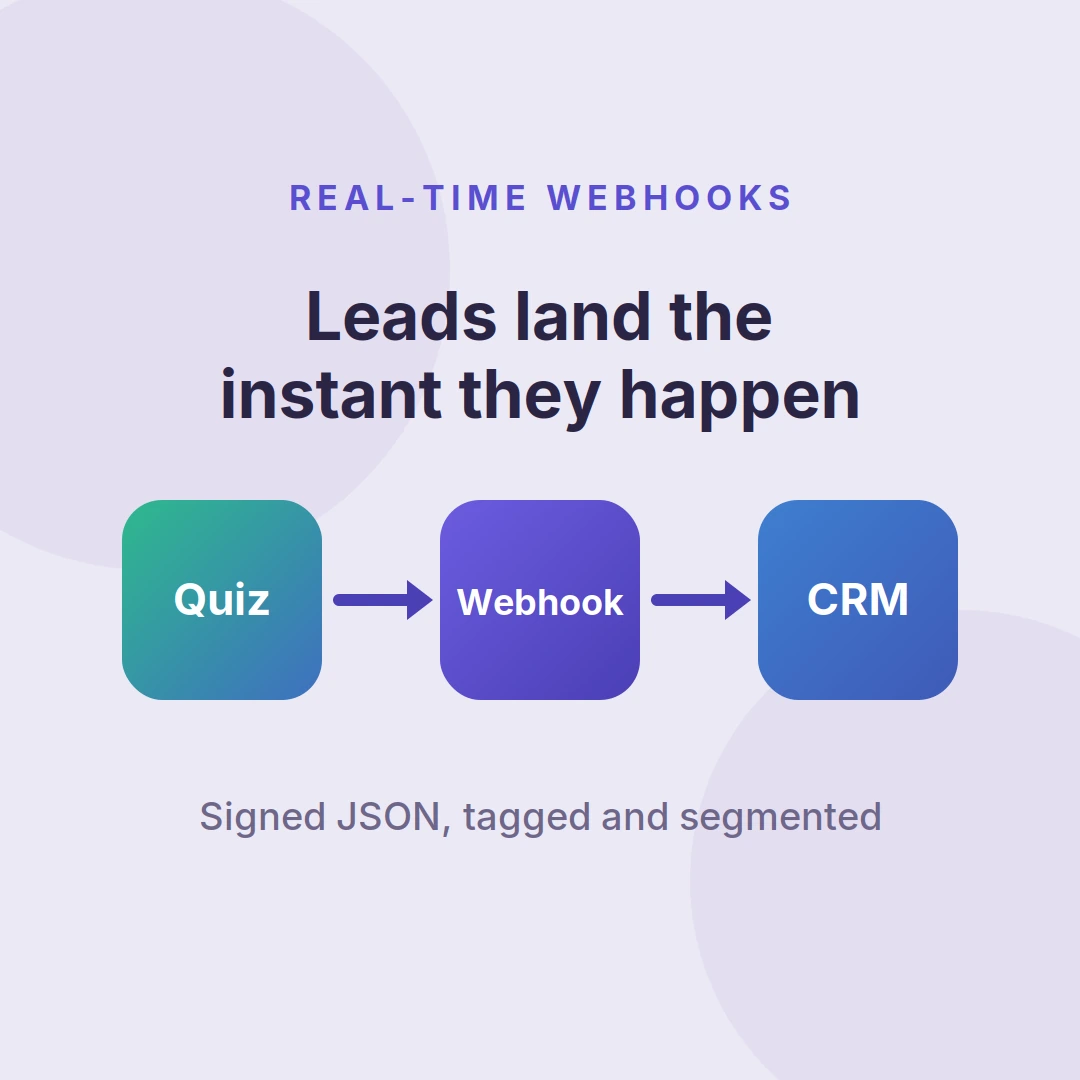
Where the API is a pull model, webhooks push. Riddle can POST each quiz response to your endpoint as signed JSON in real time, on every plan, which for leads and responses is often the better fit.
- Riddle POSTs each response as signed JSON to your endpoint in real time
- Payloads carry names, answers, scores, segments, and personality results
- Signed delivery lets you verify the data genuinely came from Riddle
- An official PHP SDK validates and parses incoming webhooks for you
The practical upside is speed: someone finishes a quiz and the lead lands in your CRM before they’ve closed the tab, already tagged and segmented by how they answered. See the webhook setup guide for details.
Prefer no code?
- Zapier connects Riddle to 9,000+ apps (HubSpot, Klaviyo, Slack, and more)
- Native connectors cover the essentials, including: Salesforce, Mailchimp, Brevo, ActiveCampaign, AWeber, Google Sheets
- Webhooks handle any custom destination
4. Event tracking: feed your analytics and ad platforms

Riddle fires a tracking event for every view, start, answer, and completion, and sends these events to GA4, Google Tag Manager, Meta (Facebook) Pixel, Matomo, and Adobe Analytics out of the box. It also exposes a raw JavaScript event stream you can push to any other analytics platform, ad network, DMP, or data warehouse.
Send events out of the box to:
Or tap the raw JavaScript event stream and push events anywhere – another analytics platform, an ad network, a DMP, or your data warehouse.
Close the attribution loop
The Data Layer brings data in as well as out:
- Pass data into a Riddle by URL parameter or JavaScript
- Pre-fill details you already know
- Carry campaign and UTM IDs through to every captured lead, so you can attribute a lead back to the exact campaign that drove it
Build better ad audiences
- Create retargeting audiences from people who completed a quiz or submitted a form
- A warm, self-qualified segment beats a generic pageview audience
5. The Riddle MCP: quiz analytics with Claude and other AI tools
This is the one to watch, and it’s included with every plan. The Riddle MCP connects your account directly to Claude and other AI assistants, so you can ask plain-language questions and get an answer built from your real stats. The AI pulls the numbers, spots the drop-off, and writes a full performance report in seconds, no dashboard digging or CSV wrangling. It turns analytics from something you read into something you can simply ask for.
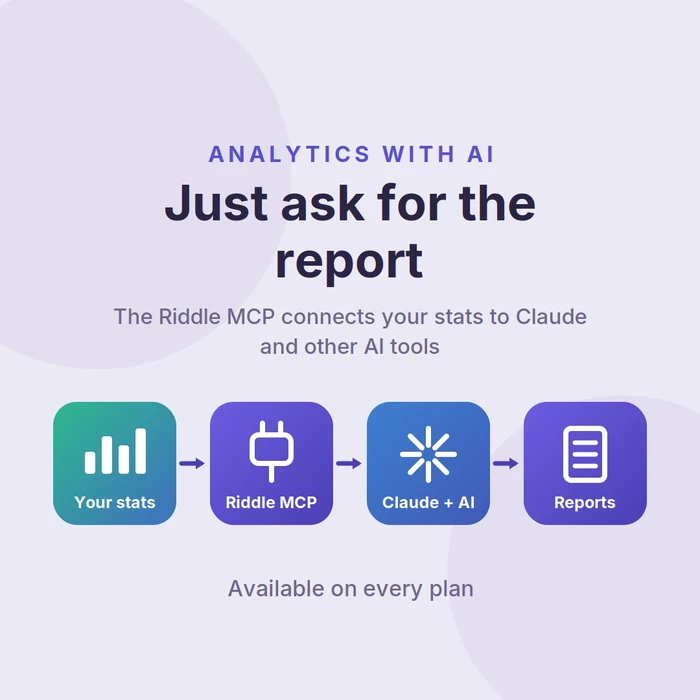
Instead of exporting a CSV and building a chart, you just ask. For example:
- “Which quiz lost the most people last month, and at which question?”
- “Compare completion rates across every quiz in my Sports project this quarter.”
- “Which content type captures the most leads: quizzes, polls, or personality tests?”
- “Show me where mobile users drop off compared to desktop.”
Because the MCP exposes the same quiz analytics data as your dashboard and Stats API, the AI can answer follow-ups, dig into a single question’s answer breakdown, or turn any of it into a report, a chart, or a client-ready summary.
Ask in plain language, get back something you can act on or send.
Can Riddle connect to Looker Studio and BI tools?
Yes. Riddle’s Enterprise plan includes a native Google Data Studio (Looker Studio) connector, and the Stats API can also feed Looker Studio, an in-house tool, or a data warehouse.
This lets publishers and brands view interactive-content data next to their traffic, ad revenue, and subscription numbers instead of in a separate silo. Either way, Riddle becomes another data source in your BI stack, refreshing on its own.
This matters most for reporting up the chain:
- Forget the “here’s a screenshot from the quiz tool” – instead, get live numbers in the company dashboard
- For sponsored or client campaigns, schedule a project-level pull so a performance report goes out every month with no manual work
Custom dashboards for every stakeholder
The connector isn’t a single fixed view. You can build a different dashboard for each team, drawing on the same underlying data:
- Senior management – a high-level executive summary with the headline numbers: total engagement, leads captured, and growth over time
- Editorial – granular performance broken down by content type, so you can compare how quizzes stack up against tests, surveys, and polls
- Advertisers and sponsors – a dedicated campaign dashboard showing how a sponsored quiz or campaign is performing, ready to share with the advertiser as proof of delivery
- Any other team – shape a view around exactly the metrics that team cares about, without exposing the rest
And you don’t have to wait for anyone to log in. The scheduled report option emails PDF snapshots of your dashboard highlights to stakeholders at whatever interval you set – daily, weekly, or monthly – so the right people get the numbers in their inbox automatically.
How the pieces fit together
The strength isn’t any single method – it’s that the same quiz analytics data is available at whatever level a team needs:
- Editors check the dashboard and export a CSV for a quick recap
- Campaign managers use webhooks and native connectors to get tagged leads into the CRM in real time
- Developers wire the Stats API into Looker Studio next to the rest of the business
- Marketing ops pipe events into GA4 and Meta and close the loop with UTMs via the Data Layer
- Sponsored content teams run an automated monthly client report off the API
Same data, different doors in. Nobody waits on another team, and nothing has to be rebuilt as you grow.
We don’t just believe quiz analytics matter, we run the experiments
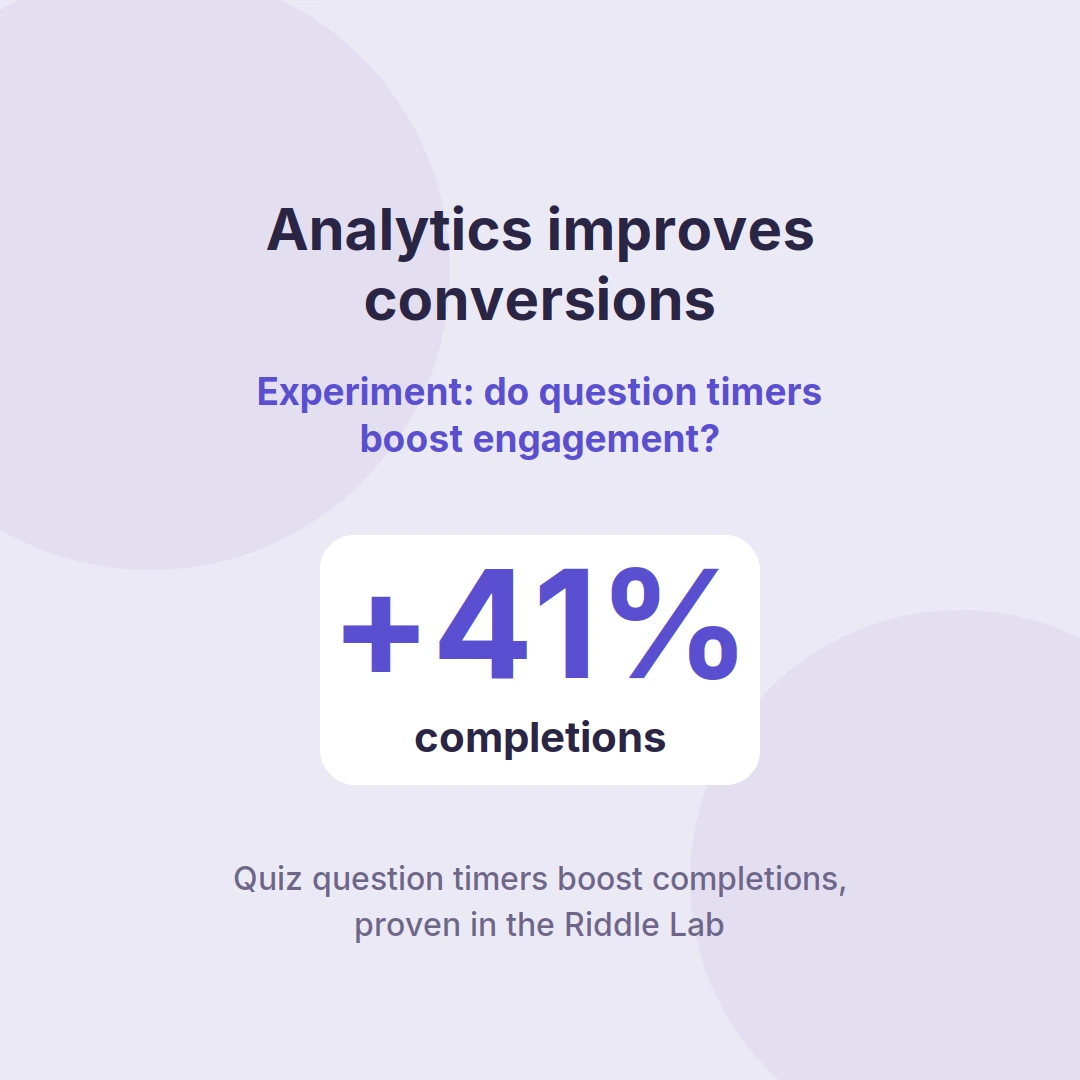
We’re firm believers that measurement drives better performance, and we hold ourselves to it. The Riddle Lab is our ongoing series of controlled A/B tests on interactive content, and every finding comes from the same block-level quiz analytics your account gives you.
A few examples:
- Quiz timers get 41% more completions. Adding a per-question timer raised completion from 36.8% to 52.1% versus the same quiz with no countdown – the fix is a single settings change. Do quiz timers boost completions and dwell time?
- Ads grow revenue and only lose 13% of readers. A single in-quiz ad costs just 13-16% of the readers who reach it, and mid-quiz placement holds its audience as well as pre-results while reaching more people. How much do in-quiz ads cost you in completions?
- Mandatory forms convert 34% vs 24% for skippable. We ran identical Riddles differing only in the form, and the mandatory version captured far more leads with identical lead quality either way. What’s the best place for a form in your quiz?
- Quiz ads hit 22.97% CTR vs 13.48% for standard ads. Quiz-based lead capture drove a 37% lower cost per lead than pop-ups, because a quiz holds attention across several questions before asking for the email. Pop-up vs. quiz conversion rates
The point isn’t just the results. It’s that every one of these was found with block-level stats, funnel drop-off, and answer breakdowns – the exact analytics on your dashboard and in the Stats API. The same tools we use to run these experiments are the tools you use to run yours.
Browse the full library at Riddle Lab.
Does Riddle limit views, content, or leads?

No. Every Riddle plan includes unlimited content, unlimited views, and unlimited leads and responses. Quiz analytics scale only if your content and audience can, so there is no per-play metering and no cap on the data itself. Every plan includes:
- Unlimited content – build as many quizzes, polls, and games as you want
- Unlimited views – no per-play metering
- Unlimited leads and responses – capture everything, no caps on the data itself
- All 35+ content formats, including leaderboards
Pricing
Every plan includes a 14-day free trial, fully featured, no credit card required.
- Pro – from $119/mo (annual): unlimited content, views, and leads, white-labeled branding, all 35+ formats, full dashboard analytics and CSV/XLSX export, and the Riddle MCP connector for AI tools
- Business – from $349/mo (annual): everything in Pro, plus the Stats & Builder API, custom event tracking, custom CSS and fonts, mp4 uploads, and advanced tracking (GTM, GA, Matomo, custom scripts)
- Enterprise – from $749/mo (annual): everything in Business, plus the Google Data Studio (Looker) connector, custom DMP integration, programmatic ad support, custom roles, seasonwide leaderboards, and bespoke infosec/legal documentation
Add-ons across all plans: $19 per additional user, $39 per additional domain. Non-profits receive a 20% discount, and there’s a 30-day money-back guarantee.

See your own numbers
Interactive content that engages your audience is table stakes. Interactive content you can measure, pipe into your stack, and report on automatically is what makes the case to keep investing.
Start your 14-day free trial with every feature unlocked and no payment details needed, or book a demo and we’ll walk through the quiz analytics setup for your team.
Frequently asked questions
What is the best quiz maker with analytics for publishers?
Riddle is built specifically for publishers and media companies that need analytics, and is used by the BBC, CNN, Sports Illustrated, and SRF. It combines answer-level dashboard analytics, a Stats API, real-time webhooks, and a Looker Studio connector with publisher features like white-label branding, in-content ad serving, and EU hosting. Unlike most quiz makers, it puts webhooks and full event tracking on every plan rather than reserving them for the top tier.
Does Riddle have built-in quiz analytics?
Yes. Every published Riddle has a no-code analytics dashboard showing views, starts, completions, answer-by-answer breakdowns, and lead conversion rates. You can export stats as CSV and leads as CSV or XLSX. No setup or tagging is required for the core metrics.
Can I access quiz analytics through an API?
Yes. The Riddle Stats API lets you pull data for any Riddle, project, or your whole account, with five endpoints covering high-level fetches, time-series overviews, and detailed human-readable breakdowns. The Stats API is available on the Business and Enterprise plans.
Does Riddle integrate with Looker Studio (Google Data Studio)?
Yes. Riddle’s Enterprise plan includes a native Google Data Studio connector to visualize Riddle data alongside your website data. You can build custom dashboards for different teams – a high-level summary for senior management, a detailed content-type breakdown for editorial, and campaign dashboards for advertisers and sponsors – and schedule reports that email PDF snapshots of the highlights to stakeholders at regular intervals. You can also feed the same data into Looker Studio, an in-house tool, or a data warehouse through a scheduled Stats API pull.
Does Riddle support webhooks?
Yes. Riddle can POST each response to your endpoint as signed JSON in real time, including names, answers, scores, and segments. There’s an official PHP SDK to validate and parse incoming webhooks, plus Zapier and native connectors if you’d rather not write code.
Is my data private and compliant?
Yes. Every lead and response is stored encrypted on Riddle’s own servers in Germany and Luxembourg. Riddle is 100% GDPR and CCPA compliant and ISO 27001 certified, never stores IP addresses, and offers a Data Processing Agreement on request.
Can I see which quiz questions cause people to drop off?
Yes. Riddle records block-level stats for every question, including how many times each individual answer was chosen and where completion falls off. This shows you the exact question causing drop-off, not just an aggregate completion rate, so you can fix the specific step losing people.
Can I use Claude or another AI tool to build my own quiz analytics?
Yes. The Riddle MCP connector links your account to Claude and other AI assistants, so you can ask for analysis in plain language and have the AI pull your real stats, find where quizzes lose people, and generate a full report. It uses the same underlying data as your dashboard, and it’s available on every plan.