A new report from Riddle, drawing on more than 3.8 billion content views and over 1 billion active engagements across the past 12 months.
Search referrals are fading, and AI answers are absorbing clicks that once flowed to publishers. That leaves media companies and brands with one clear priority: earn attention directly on their own pages.
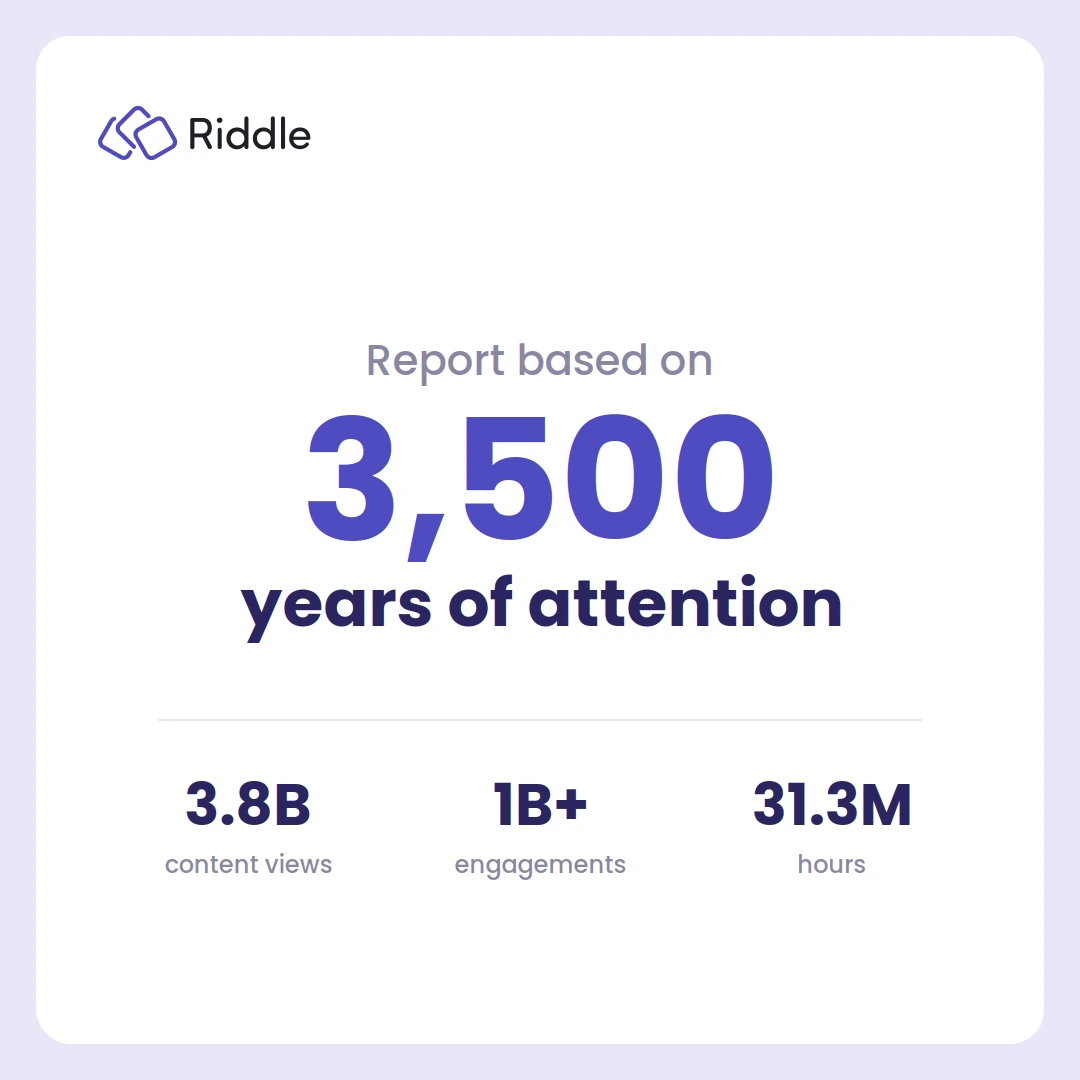
That is where interactive content statistics get interesting. Our new report, The State of Interactive Content 2026, looks at how audiences actually behave in this post-search environment. It draws on aggregated, anonymised data from across the Riddle community: more than 3.8 billion content views over the trailing 12 months, of which over 1 billion turned into active engagements. Every figure is an aggregate or a rate. No individual user data is included.
Here are the highlights, and you can download the full report for free.
The numbers at a glance:
- 112 seconds of average active engagement per interaction
- 72.7% overall completion rate, nearly three in four people who start
- 3.8 billion+ content views and 1 billion+ active engagements analysed
- 31.3 million hours of total audience attention, over 3,500 years
- 78% of sharing happens over “dark social” that analytics can’t track
Interactive content statistics: attention at scale
The headline number is 112 seconds. That is the average time a person spends actively engaging with a Riddle once they start one. Across the sample, that adds up to more than 31 million hours, or over 3,500 years, of audience attention on interactive units alone.
For context:
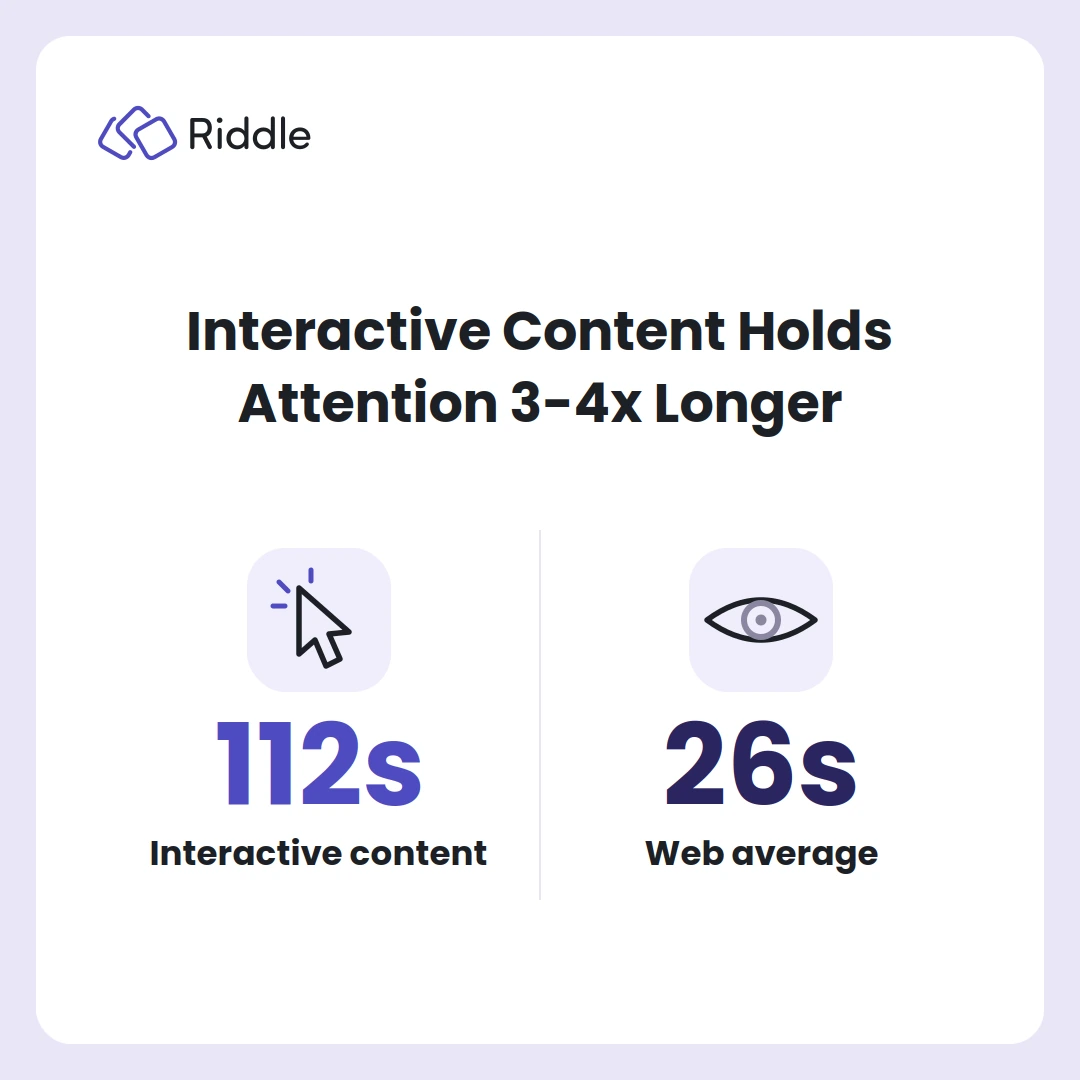
- Interactive content holds attention for 112 seconds on average
- Chartbeat records about 26 seconds of engaged time across the web (Q2 2026, measured the same active way)
- That makes interactive units roughly 3 to 4 times stickier than a typical page
Interactive units don’t just get seen. They get used, and for far longer than a scroll past an article or a display ad.
Completion rates are high
Nearly three in four people who start a Riddle finish it (72.7%). And once past the first question, drop-off is minimal. The pattern is consistent across the data: the first question is where you win or lose the audience.
- About 18% of starters drop at the first question
- After that, question-to-question submit rates stay above 94% all the way through
- Momentum compounds, the further in someone gets, the more likely they are to finish
The practical takeaways: invest heavily in a strong first question, and keep things to around 5 questions where completion is the goal.
Format choice matters
Different formats do different jobs:
- Quizzes are the workhorse. Nearly half of everyone who sees a quiz starts it, three-quarters finish, and they hold attention for over two minutes. That balance of reach, depth, and completion makes them the most widely used format.
- Personality tests pull people in best. The “which one are you?” hook drives the highest view-to-start rate of any format (52.7%), and they are also the most shareable.
- Polls are frictionless. Near-total completion (around 99%) in just seconds, ideal for lightweight engagement and sentiment capture at scale.
- Mini-games are the dwell-time champions. At roughly 6.6 minutes of average engagement, they hold attention about 3 times longer than a quiz, which makes mini-games the clear solution for publishers looking to boost time on site.
Sharing happens where analytics can’t see it
Interactive content earns organic distribution, and most of it is invisible to standard measurement:
- Roughly 78% of all sharing happens over “dark social”, private channels like WhatsApp, Messenger, email, and copy-pasted links
- WhatsApp alone drives three-quarters of shares
- These channels show up as “direct” traffic with no referrer, so conventional analytics cannot see them
The implication is straightforward: on-platform share counts materially understate true reach, because most of the sharing, and the referral traffic it generates, never shows up in your reports.
The bottom line
As search referrals decline, publishers and brands are building engagement directly on their own pages. The data is consistent across every format and vertical. Interactive content delivers:
- Sustained attention, averaging 112 seconds per engagement
- High completion, near three in four people who start
- Organic sharing that reaches well beyond what analytics capture
- First-party data, collected at the same time
That mix of attention, first-party data, and distribution earned on your own pages is a strong foundation to build on.
Download the full report
The full report goes deeper on all of the above, with a complete methodology, format-by-format breakdowns, findings across 10 verticals, the full engagement funnel, and a detailed look at lead-generation placement and social sharing.
Download The State of Interactive Content 2026 (PDF) – free, no form required.
FAQ about interactive content statistics
What is the average completion rate for interactive content?
Across more than 1 billion active engagements in the 2026 report, the overall completion rate is 72.7%, meaning nearly three in four people who start a Riddle finish it. Once past the first question, question-to-question submit rates stay above 94%.
How long do people spend on interactive content?
The average person who starts an interactive unit spends 112 seconds actively engaging with it. That is roughly 3 to 4 times the average engaged time Chartbeat records across the web (about 26 seconds in Q2 2026), measured the same active way.
Which interactive content format holds attention longest?
Mini-games are the dwell-time champions, holding attention for roughly 6.6 minutes on average, about 3 times longer than a quiz. Quizzes balance reach, depth, and completion, which makes them the most widely used format, while personality tests have the highest view-to-start rate at 52.7%.
Where does interactive content get shared?
Most sharing happens where standard analytics cannot see it. Roughly 78% of all shares travel over “dark social”, private channels like WhatsApp, Messenger, email, and copy-pasted links. WhatsApp alone drives about three-quarters of shares, which means on-platform share counts understate true reach.
Riddle powers interactive content for publishers, media companies, and brands worldwide, with 35+ formats, EU-based and 100% GDPR-compliant. To see what it could do for your audience, start creating free or book a demo.