Standard web content is struggling to hold onto a distracted audience. Our latest data from Riddle’s 2025 Quiz Marketing Report shows that while traditional page views are becoming shorter and more passive, interactive content is moving in the opposite direction.

We analyzed billions of data points from the Riddle interactive content platform over the past year (8.96 billion in all!). The results show that for brands and publishers, the focus has shifted from merely getting a “click” to sustaining a meaningful dialogue. In the current attention economy, the brands that win are the ones that stop talking at their audience and start listening to them.
3.13 BILLION Questions: The Power of Active Participation
The most important metric in this year’s report isn’t the total traffic – it is the depth of the interaction. In 2025, Riddle users answered 3.13 billion individual questions.
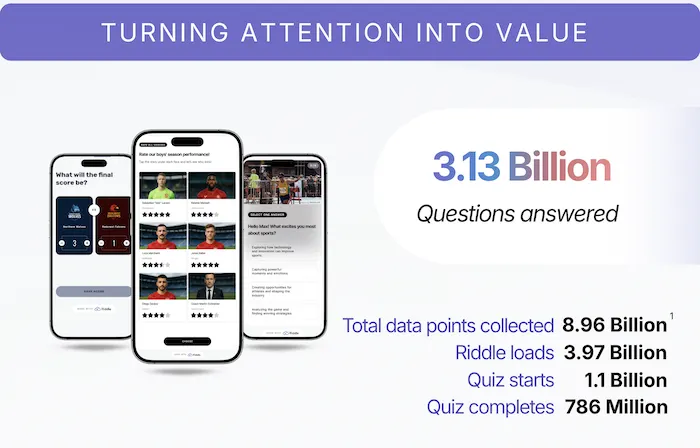
This is a critical distinction for marketers and publishers. A “page view” can be accidental or passive, but answering a question requires a conscious decision. This represents billions of “micro-conversions” where users are actively telling brands who they are and what they want.
- Intent-driven data: 3.13 billion questions answered
- Funnel movement: 1.2 billion lead forms were started
- Commitment: 766.8 million users reached the final result
By focusing on the number of questions answered, we can see that users aren’t just clicking – they are participating in a multi-step journey. This level of activity provides more insights into user preference than any traditional tracking pixel ever could, especially in a world where browser privacy limits standard tracking.
Download Riddle’s 2025 Quiz Marketing Report (PDF)
Ready to go deeper? Download the full PDF of ‘Riddle’s 2025 Quiz Marketing Report’ – with benchmarks, case studies, technical setup guides, and the complete launch sequence.
The Engagement Gap: How Quizzes Triple Time on Site
Passive content is losing the battle for attention. Our data shows a 3.02x improvement in engagement when comparing quizzes to standard web pages. While a typical blog post or news article might see a user bounce after 54 seconds, quizzes are holding attention far longer.
Time Spent and Completion Rates
- Total Time Spent: Users have spent a combined 32.8 million hours interacting with Riddle content – that’s equivalent to 3,744 years of engagement.
- Formats Matter: The average session duration across all formats – including quizzes, polls, and mini-games – is 1 minute 46 seconds. Quizzes and personality tests significantly outperform that benchmark, delivering sessions that are 58% longer at 2 minutes 48 seconds.
- Global Completion Rate: Despite growing competition for attention, the average completion rate for all formats remains strong at 73.4%.
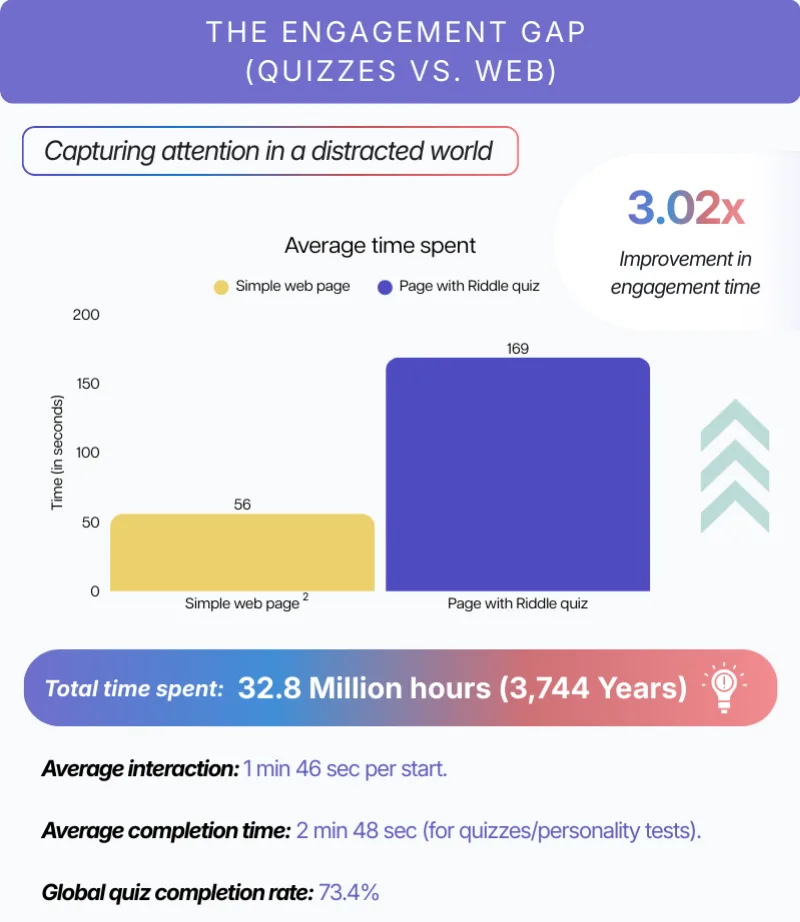
The data suggests that attention spans are not shrinking – audiences are simply more selective about where they invest their time. When content is interactive and offers clear personal value, such as a personality result or knowledge score, users stay meaningfully longer. For publishers, that additional time on page directly supports stronger ad viewability and improved brand recall.
Privacy and the Zero-Party Data Strategy
With the death of third-party cookies and increasing privacy regulations like GDPR, brands need a way to collect data that doesn’t rely on “sneaky” tracking. Zero-party data – data that a customer gives you willingly and proactively – has become the primary solution for 2025.
Quizzes offer a clear value exchange: the user provides their preferences, and in return, they get personalized feedback. This creates a transparent relationship from the first click.
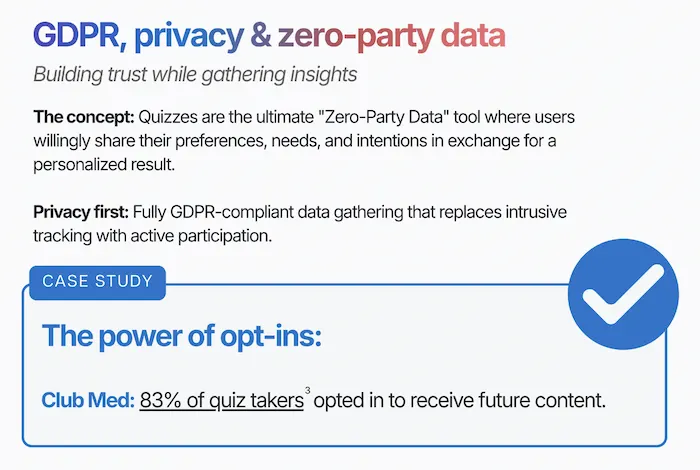
Case Study: Club Med
By centering their strategy on interactive content, Club Med achieved a 83% opt-in rate.
These users aren’t just passive leads; they are individuals who actively requested to hear more from the brand based on their quiz experience. This proves that users aren’t afraid to share data – they just want to know what they are getting in return.
The WhatsApp Dominance (Dark Social)
The way content spreads has shifted from public feeds to private conversations. Our data shows that “Dark Social” – specifically private messaging apps – is where the majority of sharing now happens. This is a challenge for traditional analytics, but a massive opportunity for organic growth.
WhatsApp is the undisputed leader, accounting for 74% of all quiz shares.
- WhatsApp: 74%
- Facebook: 11%
- X (Twitter): 9%
- LinkedIn: 3%
When a user shares a quiz result on WhatsApp, it carries the weight of a personal recommendation.
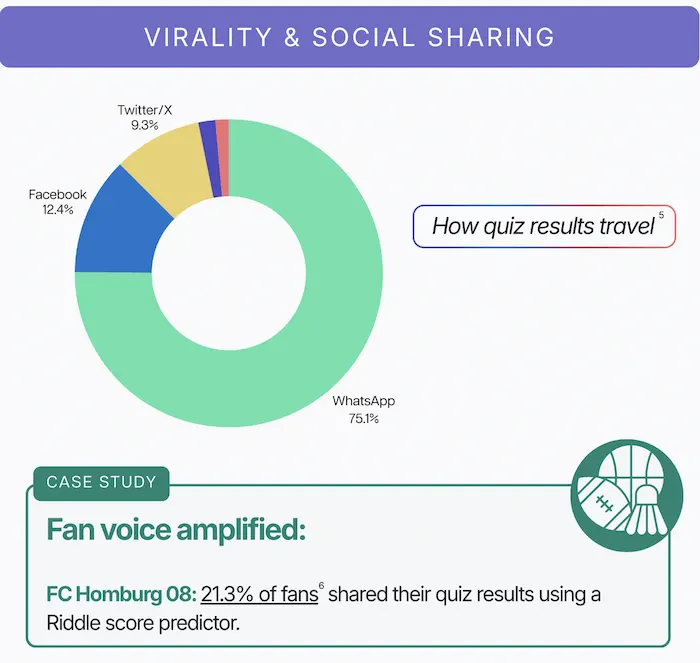
Case study – FC 08 Homborg:
German pro soccer team saw 21.3% of fans share their results.
This proves that high-affinity audiences use quiz outcomes as a form of social currency within their private circles. For marketers, this means the “viral loop” is moving away from the noise of public timelines and into the high-trust environment of group chats.
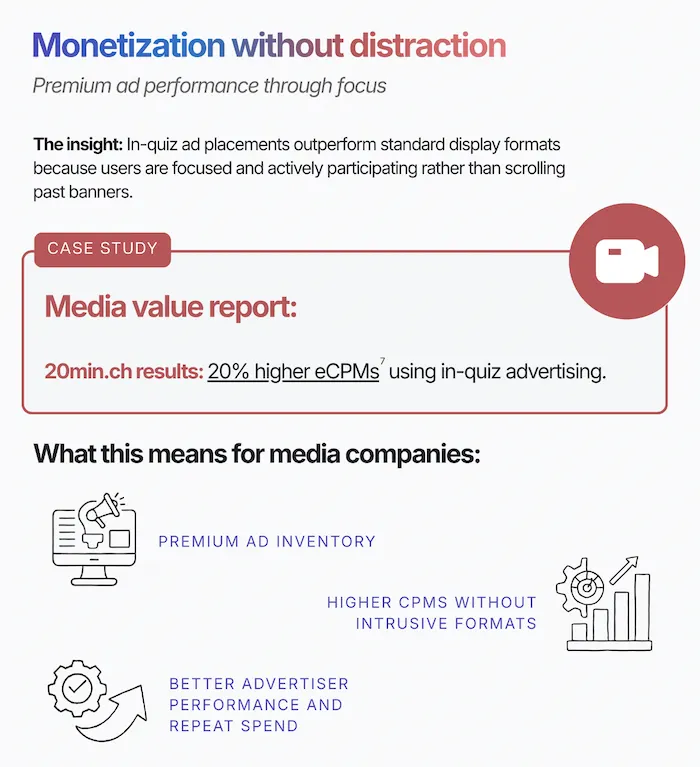
Monetizing Attention: Higher Ad Viewability through Interaction
For media companies, the struggle is balancing revenue with user experience. Traditional display ads are often ignored or blocked. However, “In-Quiz” advertising integrates the brand message directly into the flow of the content, making it part of the user’s focus rather than an annoying distraction.
Case Study – 20min.ch:
Swiss publisher 20min saw a 20% increase in CPM for ad units placed in a Riddle vs. comparable ad units on their site.
This approach bypasses “banner blindness” by placing the message where the user is already looking – the center of the screen during a question sequence (such as using Riddle’s ad block).
Lead Gen ROI: A 37% Reduction in Costs
For performance marketers, the most significant takeaway is the efficiency of quiz-based lead forms compared to standard pop-ups or sidebar sign-ups. We analyzed this in a Riddle Lab experiment titled “Pop-up vs. Quiz Conversion Rates” which tracked leads generated through paid traffic.
Our data shows that ads mentioning “quiz” consistently outperform those without. In this campaign, quiz-based ads reached a 22.97% click-through rate (CTR), compared to 13.48% for standard ads. This higher CTR boosts volume and improves how platforms like Google prioritize your ads and calculate cost per click (CPC).
| Metric | Traditional Pop-up Ad | Riddle Quiz Ad |
| Average CPC | 0.05€ | 0.04€ |
| Click-Through Rate | 13.48% | 22.97% |
| Total Clicks | 2,129 | 2,055 |
| Total Leads | 96 | 115 |
| Cost Per Lead (CPL) | 1.11€ | 0.71€ |
Directing traffic to a quiz instead of a standard pop-up slashed the cost per lead by 37%. This ROI shift is driven by momentum; once a user invests time answering 8-10 questions, the lead form becomes a natural gateway to their results rather than a disruption.
How to Apply These Findings to Increase Engagement
Based on the data, here is how you can optimize your content to maximize session duration and audience retention:
- Aim for the “Sweet Spot” in Length: The data shows that session duration nearly doubles once a quiz exceeds 5 items. To keep users on the page for that coveted 2:45 average, aim for 6 to 10 questions.
- Leverage In-Quiz Monetization: If you are a publisher, stop relying solely on sidebar ads. Use in-quiz ad placements to ensure your sponsors are seen during the highest point of user focus.
- Write for “Dark Social” Sharing: Since 74% of shares are on WhatsApp, customize your “result share text” to be personal and conversational. Instead of “I got 10/10,” try “I just scored 10/10 on the Music Trivia quiz – can you beat me?”
- Focus on the Value Exchange: Don’t just ask for an email. Ensure your quiz results provide genuine insight or entertainment that makes the lead form feel like a fair trade.
Summary: Value-First Marketing in 2025
The data from this year’s report confirms that the future of digital growth is built on active participation and privacy-compliant data. Whether you are looking to lower your lead costs or increase time on site, the solution lies in asking questions rather than just broadcasting messages.
Download Riddle’s 2025 Quiz Marketing Report (PDF)
Ready to go deeper? Download the full PDF of ‘Riddle’s 2025 Quiz Marketing Report’ – with benchmarks, case studies, technical setup guides, and the complete launch sequence.
Ready to see these numbers in action for your own brand?
Start your 14-day free trial with Riddle today.
FAQ About Riddle’s Quiz Marketing Report
What is Riddle’s Quiz Marketing Report?
Riddle’s Quiz Marketing Report is a data-driven analysis of interactive content performance, powered by 8.96 billion data points and 3.13 billion questions answered in 2024. Created for publishers and media companies, the report shows how quizzes, polls, and personality tests outperform traditional web pages in engagement, data collection, and monetization. It demonstrates a shift from passive page views to active participation, helping media brands build stronger audience relationships and measurable growth.
What does the Quiz Marketing Report reveal about audience engagement?
The 2025 Quiz Marketing Report shows that quizzes generate 3.02x more engagement than standard web pages. While typical articles average 54 seconds of attention, quizzes and personality tests reach average session durations of 2 minutes 48 seconds. In total, users spent 32.8 million hours interacting with content. For publishers, this increased time on site improves ad viewability, strengthens brand recall, and supports more sustainable digital revenue models.
What does the report say about social sharing trends?
Riddle’s Quiz Marketing Report reveals that 74 percent of quiz shares happen on WhatsApp, reflecting the rise of dark social distribution. Instead of spreading primarily through public feeds, interactive content now travels via private messaging apps and trusted peer networks. For publishers, quiz results become shareable social currency. Optimizing results pages with conversational share text can significantly increase organic reach and audience growth.
What is the ideal quiz length?
Riddle’s Quiz Marketing Report identifies a sweet spot of 6 to 10 questions for maximizing engagement. Session duration nearly doubles once a quiz exceeds five items, with averages approaching 2 minutes 45 seconds. This structure maintains momentum while increasing completion rates and data collection opportunities. For publishers, optimizing quiz length within this range helps improve time on site, ad performance, and overall audience retention.
How can publishers use quizzes to improve ad performance?
Riddle’s Quiz Marketing Report shows that in-quiz advertising improves monetization without disrupting the user experience. Swiss publisher 20min.ch reported a 20% increase in ad revenue after integrating interstitial ads within quizzes. Because these ads appear during moments of focused attention, they avoid banner blindness and deliver stronger viewability. For media companies, this creates a balanced approach between engagement and revenue generation.
How do quizzes drive zero-party data collection?
Riddle’s Quiz Marketing Report highlights zero-party data as a critical growth strategy for publishers. Quizzes create a transparent value exchange where users voluntarily share preferences in return for personalized results. This approach aligns with GDPR and evolving privacy standards by eliminating reliance on third-party cookies. For media companies, interactive content enables compliant data collection while building audience trust and improving opt-in rates.