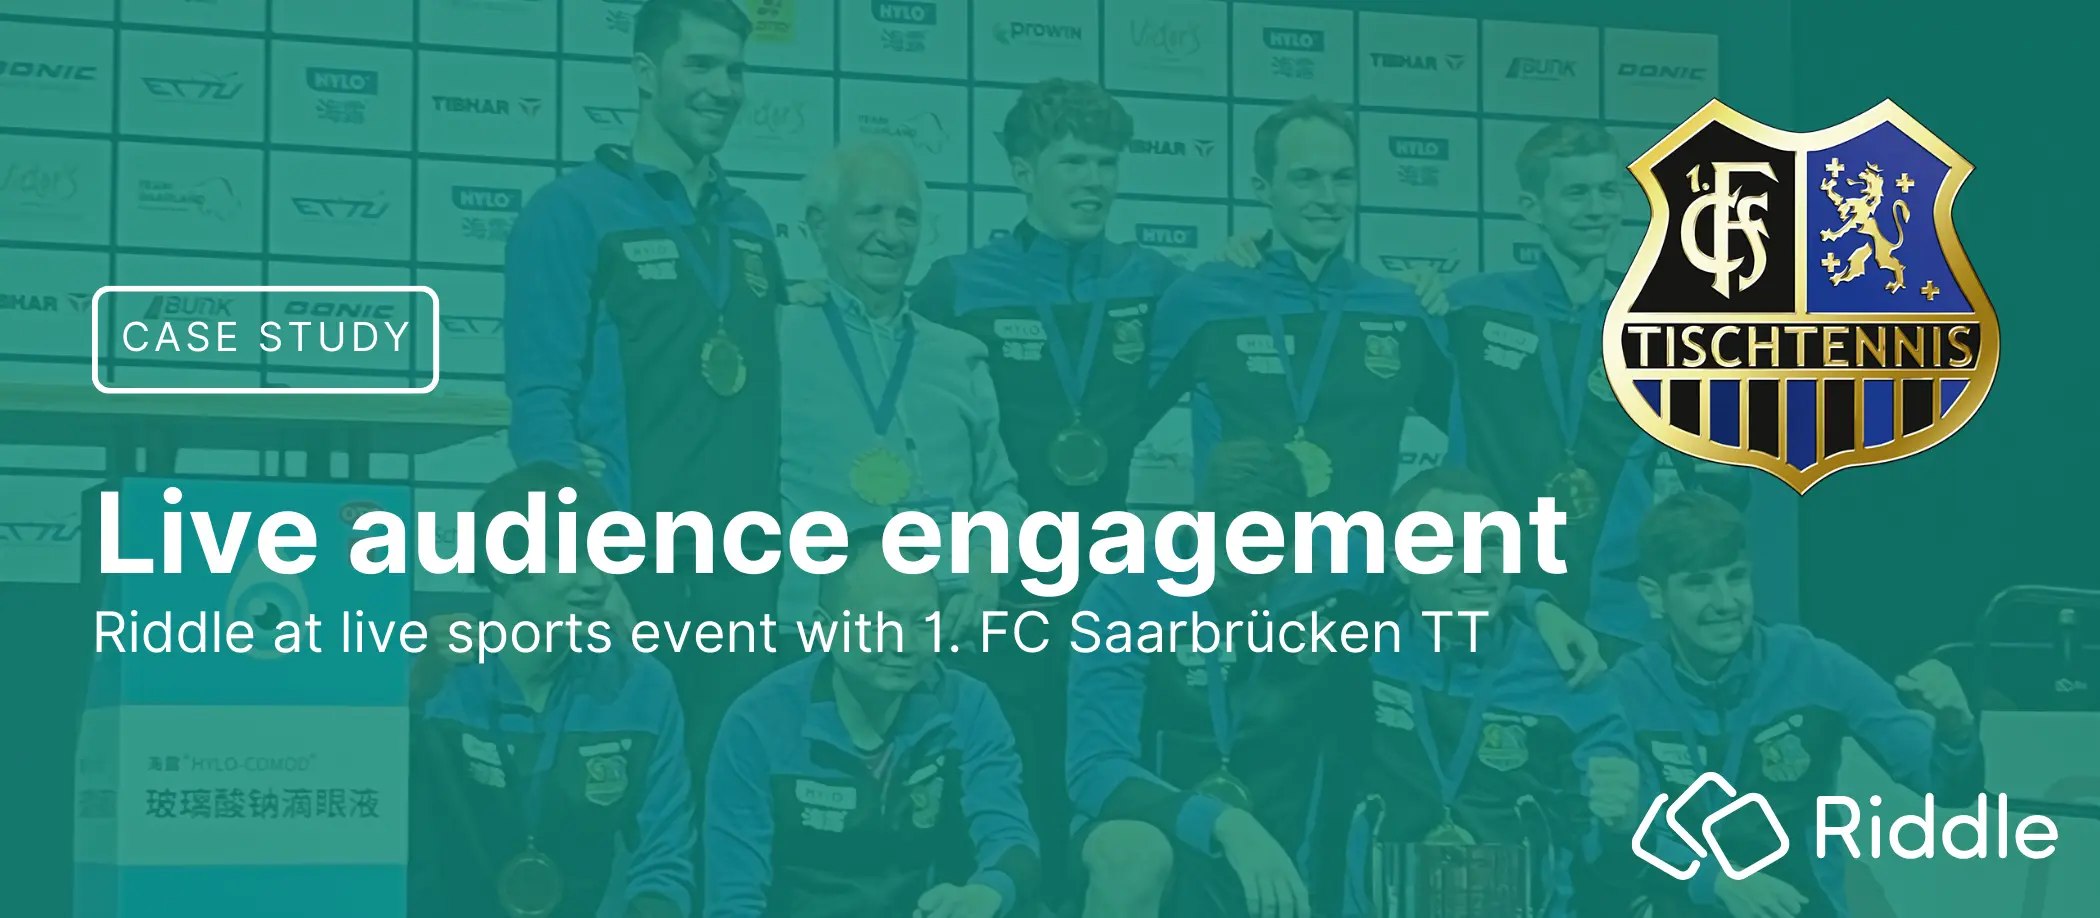
Case Study – Live audience engagement with quizzes and score predictors
The European Table Tennis Champions League Final Four tournament is one of the biggest team events in the table tennis event calendar. Europe’s top four teams compete over two days to crown the Champions League winner.
This year’s final was organized by the reigning champions – 1. FC Saarbrücken TT (Germany). Nicolas Barrois, Saarbrücken’s team manager, keen to use the event to get more people interested in table tennis in general as well as in the regular team home games, turned to Riddle to organize audience engagement during the event.
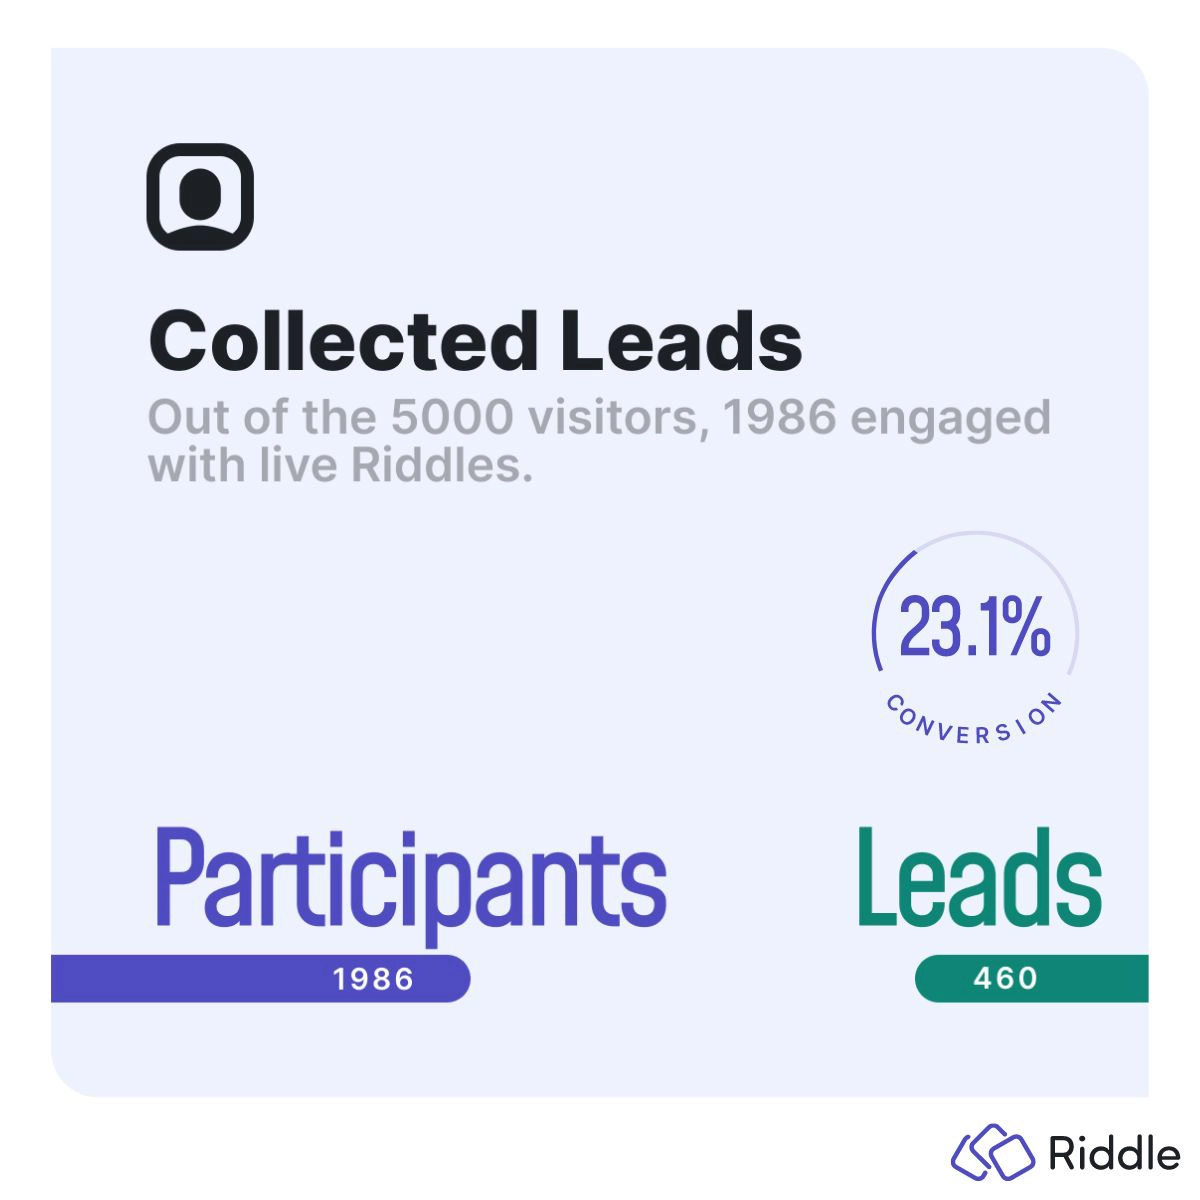
The event attracted a total of 5000 people (among them approximately 2600 unique visitors) to the two-day tournament.
The aim was to collect as many double-opt-in confirmed email addresses from these visitors as possible using the following content formats:
- Table tennis quiz prior to the first match, where the highest score won an instant upgrade to the VIP lounge.
- Score predictors for the individual matches, where the correct prediction won either signed event shirts or VIP tickets for Saarbrücken home games.
- MVP voting to crown the player of the match with live updates of the MVP standings on Saarbrücken’s website.
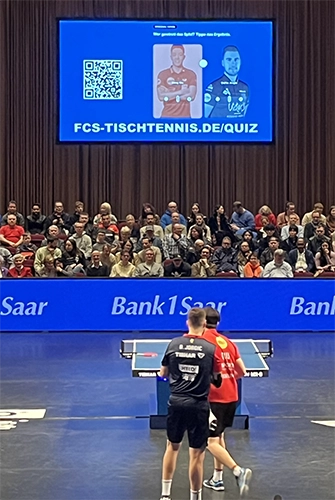
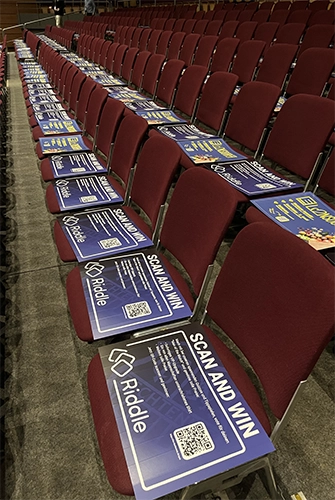
The biggest challenge was promoting the Riddles to the audience. With clap banners on most seats in the arena, the audience could scan a QR code, which launched the quiz and predictors. The stadium announcer also reminded people to vote during the event itself, and the QR code was displayed on the jumbotron throughout.
Results
With a total of 5000 visitors over the two days, most of whom attended both days, there were around 2600 unique visitors. We did not limit the number of times people could participate in a Riddle, meaning the lead count includes some duplicate entries. In total 47% of the leads were duplicate entries, resulting in a net lead count of 460 out of 970 total entries.
Participation:
| Content | Participants | Leads | DOI confirmed leads | Lead completion rate |
|---|---|---|---|---|
| Quiz to win VIP upgrade | 666 | 309 | 174 | 55% |
| Match predictors for semifinals to win signed event shirts | 597 | 490 | 398 | 67% |
| Score predictors for the 5 singles matches on the final day to win VIP tickets for the next home game | 723 | 546 | 398 | 26% |
| MVP vote (just for participation, no form included) | 520 | – | – | |
| Totals | 1.986 (with lead form) | 1.345 | 970 | 48% |
Conclusion
The two quizzes had the lowest lead completion rate, which can be put down to three factors:
- The quiz was extremely difficult (this was on purpose since the prize was valuable for the quiz audience), and the form had more fields than any of the other Riddles because we had to ask for seating information.
- The drop-off rate in between questions was 2.46% for the first quiz we ran prior to the semifinals and 6.29% for the quiz we ran on the final day.
- The quiz had a timer set to 12 seconds per question. On a difficult question, the timer would run out, which led people to restart the quiz and try again vs. trying to finish.
The quiz on the final day started off with a really difficult question, whereas the second question was also particularly hard, leading to a drop-off rate of 9.7%. Given that we were running this Riddle live with a high-value prize up for grabs, we could not change the questions on the fly. If this had been a quiz on a website without any sort of competition, we would have adapted the questions based on the drop-off percentages, either making the questions slightly easier or moving the question with the highest drop-off rate to the end of the quiz.
Feedback from the people we interviewed in the audience who had taken the quiz was that they gave up initially if they did not know an answer, looked up the correct answer on their mobiles, and then restarted the quiz. Although Riddle has settings to prevent people from taking a quiz multiple times, we decided against using these and allowed multiple entries.
The match predictors had higher completion rates than the individual game predictors (in table tennis Champions League games, a match is played as best of five, so the total number of individual games ranges from three to five). With breaks between individual games lasting only up to 10 minutes, most spectators didn’t have enough time to participate and go to concessions or restrooms. The match predictor for the second semifinal was the Riddle with the highest participation rate. There was a one-hour break in between the two semifinals, giving people enough time to vote.
Event Setup for Audience Engagement
| Time | Task | Notes |
|---|---|---|
| 4 hours prior to start | Publish Quiz for VIP upgrade. | Promote via Social, in-seat ad, Jumbotron, and announcer. In-quiz lead form asks for seating information. |
| 30 minutes prior to start | End quiz, draw winner. Replace quiz on landing page with score predictor. | Random selection out of those with 100% scores. |
| 25 minutes prior to start | Hand out VIP upgrade to winner with announcer and live camera crew. | After announcing the winner, tell people about the score predictor and the next chance to win. |
| 5 minutes after start | End score predictor and replace with the next Riddle. In a tournament, this can be the next score predictor; in a one-game event, this should be the MVP vote. | At half-time, promote the next score predictor or the MVP vote. |
| After the game | End score predictor and show end result. Draw winner and announce on the page if permitted by privacy regulations. Announce MVP vote is open for 5 minutes. | |
| 5 minutes after game | Close MVP vote and announce MVP. | |
| Day after game | Send first newsletter to all participants with call to action. For example: – buy tickets for the next game – visit the shop – visit a sponsor’s website Include statistics: – how people predicted the scores – what percentage of people got the predictions and quiz questions correct? – for quiz contests, potentially show the correct answer choices |
Learnings
Promoting the pre-game quiz with the clap cards on the seats was not ideal since 80% of the audience did not go to their seats until a few minutes before the start. As a result of the pre-game routine – with hymns, team introductions, and sponsor messages – starting 20 minutes prior to the first match, the pre-game quiz had to end 30 minutes before the start. This meant that despite the prize being very attractive – an in-stand VIP upgrade, only a handful of people saw the quiz promotion in the first place. We recommend handing out information about the pre-game quiz to everyone at the ticket-scanning booths.
We collected the seat number on the lead form for the VIP upgrade, and the stadium announcer created a great show, announcing the winner before personally handing out the VIP tickets. Location permitting, this would be a fantastic event to film and stream live on the jumbotron.
One of the biggest obstacles for lead generation is the double-opt-in confirmation that is required in Europe to comply with GDPR. After checking live submissions throughout the event, we realized that we had to remind people about the DOI confirmation with stadium announcements. These announcements increased DOI confirmations by over 50%.
Finally, what we would also recommend to get higher participation rates is running the Riddles for as long as the event allows. Ideally, you can start the engagement in the days leading up to the game and promote it on social media.
Find out more, how Riddle can be used for sports teams and leagues.
Learn how to run raffles or contests with Riddle, including how to use Riddle to pick a winner and set up leaderboards.