
Leveraging Likert scales to collect rich zero-party data in surveys
Understanding your audience is the secret to creating content that sticks and drives marketing that works. Creating Likert scales in surveys and polls with a quiz maker makes them more than just fun engagement tools — they collect deep, rich zero-party data. From customer satisfaction surveys to product feedback polls, interactive content gives you crucial insights into your audience’s preferences and opinions.
For marketers, polls and surveys are more than just fun interactions. They are a gateway to understanding user preferences, behaviors, and opinions. Used wisely, these formats let you gather structured, actionable data that can guide your content strategy and improve your decision-making.
Likert scales and matrix questions stand out because of their flexibility, ease of use, and depth of insight. The concise, all-in-one form means your audience can quickly answer multiple questions on one single question block or page.

What is a Likert Scale question?
Likert scales are among the most common methods for measuring opinions, attitudes, or perceptions. You probably have seen a form of Likert scale used in the popular NPS (Net Promoter Score) surveys used by companies worldwide.
Typically displayed as a series of statements with a range of response options (e.g., “strongly agree” to “strongly disagree”), these scales allow users to express varying degrees of agreement or satisfaction.
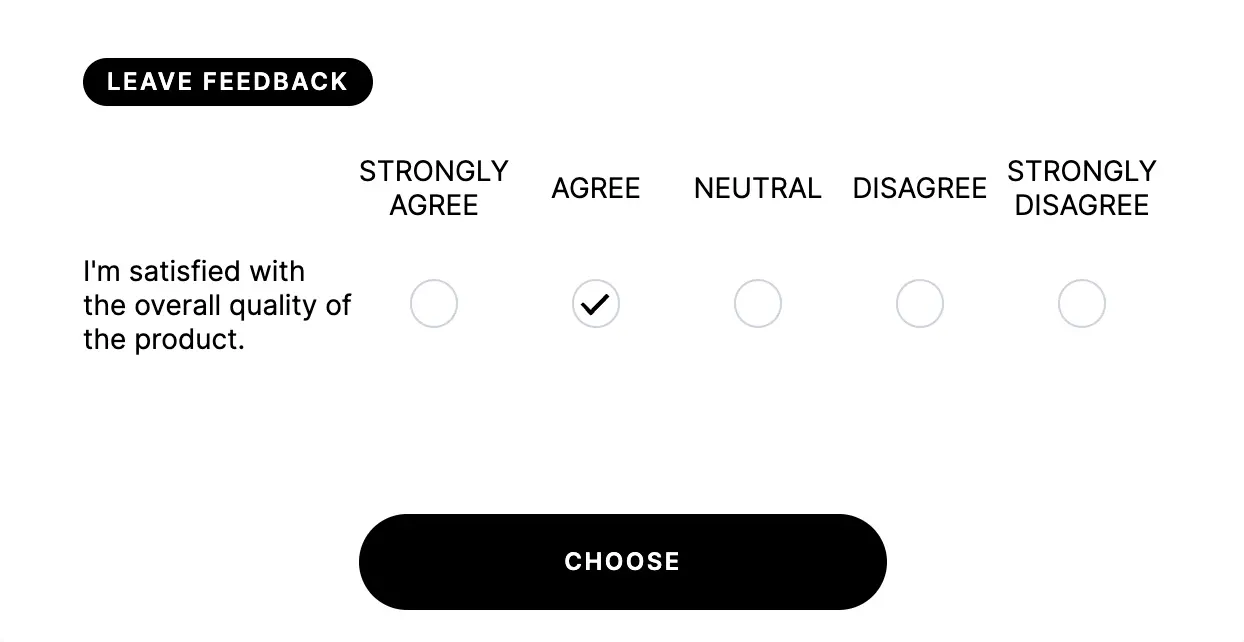
The most frequently used formats are the 5-point and 7-point Likert scales. The 5-point scale, ranging from “strongly agree” to “strongly disagree,” is ideal for simpler assessments like quick customer satisfaction checks (e.g. “You were happy with your delivery and overall shopping experience”):
- Strongly disagree
- Disagree
- Neither agree nor disagree
- Agree
- Strongly agree
On the other hand, the 7-point Likert scale offers more nuance, making it suitable for more complex evaluations, such as in-depth product feedback:
- Extremely dissatisfied
- Very dissatisfied
- Dissatisfied
- Neutral
- Satisfied
- Very satisfied
- Extremely satisfied
These examples show why Likert scales are so popular. They are easy for your audience to understand, leading to higher participation rates.
The other advantage is that each rating can be assigned a number, and you can track and measure improvements to key ratings. If your audience’s response to our shopping experience example increased from 2.3 to 3.4, you have strong evidence that your company is doing a better job at making your customers happy.
What are Matrix questions, and how should you use them?
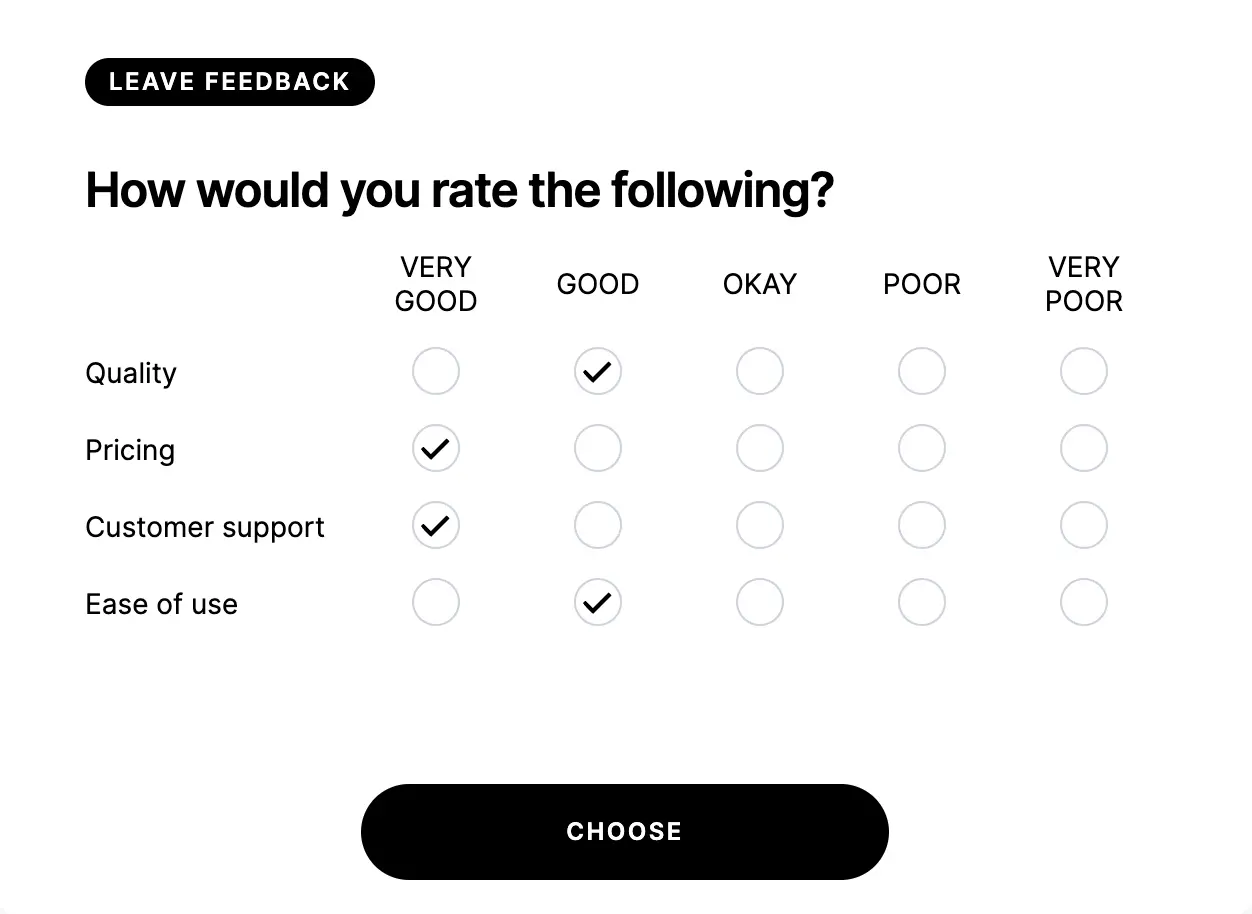
Matrix questions are another powerful tool for data collection. The concept is simple: You present a series of questions in a single block, with the same set of answer options in columns.
This is perfect for polls and survey questions that need feedback around several related topics. Imagine you want to send a survey to your attendees after a conference. With a matrix question, you could ask participants to rate various aspects of the event such as the venue, food, speakers, and overall experience, all of which are rated on a scale of “very good” to “very poor”.
The advantage here is speed. It is much faster than asking four separate questions, enabling higher completion rates for your poll or survey.
Power up your polls and surveys
You can combine Likert scales and matrix questions within a single survey for deeper insights.
For example, if you were collecting feedback about your product, you could:
- Use a Likert scale to measure overall satisfaction with the product
- Add a matrix question for customers to rate specific features (e.g. design, usability, and price)

Data analysis: making sense of the numbers
Creating your survey or poll is just the start. You will also need a robust way to analyze the data from your Likert scale or matrix questions.
There are several tools out there to help:
• Excel and Google Sheets
Spreadsheets are indispensable tools, especially when combined with pivot tables or charts.
• Your quiz maker
Most online quiz tools provide basic analytics. You can also use Riddle.com’s robust analytics module to view detailed breakdowns of your surveys.
• Looker Studio
Google’s data visualization platform is amazing (and free). Connect your data source (e.g. your Riddle survey or poll) or upload a CSV/XLS file, then drag/drop elements to create your analysis.

Wrapping things up
Likert scales and matrix questions can be your secret weapons for collecting rich first-party data. With carefully crafted questions that always keep your audience in mind, these polls and surveys push you to understand your audience and improve your product or service.
Further reading
- Learn how to use Likert scale blocks in Riddle surveys: Riddle help center article for Likert Scale Blocks
- Using a Likert scale and psychology and the advantages of Likert Scales: Verywellmind.com
Frequently asked questions
What is a Likert scale question?
A Likert scale presents a statement with a range of graded responses, typically from strongly agree to strongly disagree, so users can express varying degrees of agreement or satisfaction. It is one of the most common ways to measure opinions and attitudes, and it is the basis of NPS surveys.
Should I use a 5-point or 7-point Likert scale?
Use a 5-point scale (strongly disagree to strongly agree) for simpler checks like quick customer satisfaction. Use a 7-point scale (extremely dissatisfied to extremely satisfied) when you need more nuance, such as in-depth product feedback.
What kind of data do Likert-scale surveys collect?
They collect rich zero-party data: structured, actionable insight into your audience’s preferences, attitudes, and satisfaction that you can use to guide content strategy and decision-making.
What is a matrix question?
A matrix question asks several statements that share the same response scale in one compact, all-in-one block, so your audience can answer multiple questions quickly on a single screen.
How do I create a Likert-scale survey?
With a quiz maker like Riddle, add a Likert or matrix block, define your statements and choose a 5- or 7-point scale, then embed it on your site to start collecting responses.